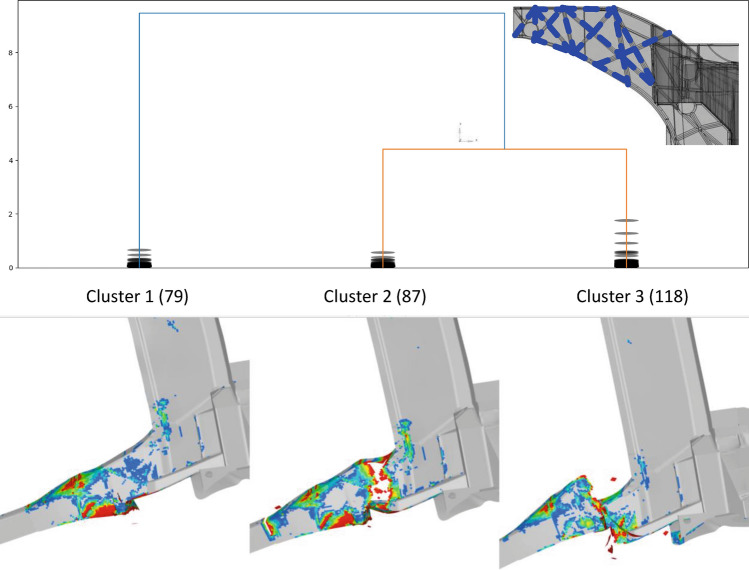
Figure 19.
Clustering result of local horn-section RSM-optimization. Top-right insert sketches the rib thickness design-space in the local horn section. The dendrogram on top shows three clusters based on material failure contour fields of last time steps of 284 samples, respectively. One exemplary contour plot for each cluster is depicted below, visualizing the significantly different failure modes identified by unsupervised clustering: Cluster 1 = local failure only; Cluster 2 = structural shear collapse mode 1; Cluster 3 = structural shear collapse mode 2.

