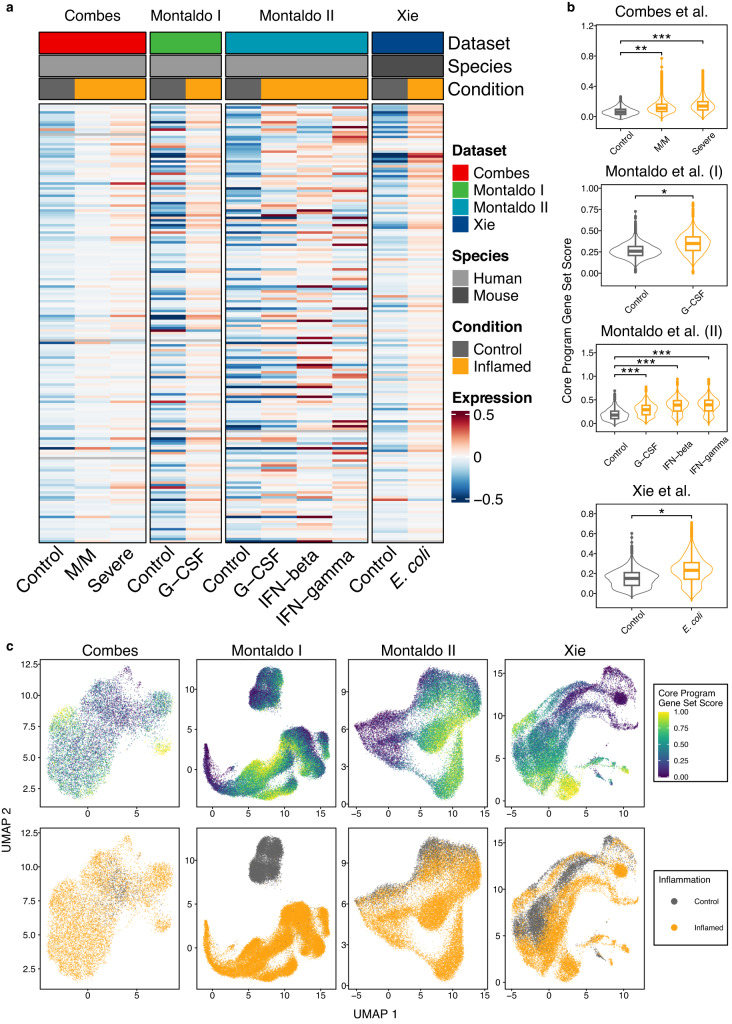
Fig. 4. Validation of the enrichment of core inflammation genes in single-cell RNA sequencing.
The first dataset (Combes) includes neutrophils of patients without (control), mild (M/M), and severe cases (severe) of COVID-19. The second dataset (Montaldo I) was derived from in vivo neutrophils from healthy controls (control) and patients treated with G-CSF (G-CSF). The third dataset (Montaldo II) used in vitro stimulation of umbilical cord blood neutrophils with G-CSF, interferon-β, or interferon-γ. The fourth dataset (Xie) consisted of neutrophils isolated from different organs of mice challenged with E. coli. a Core inflammation genes show a higher expression in inflamed samples compared to controls. Shown is a heatmap with mean scaled expression values of the core inflammation genes across all cells per condition and sample. Rows represent genes, columns samples. b Inflamed cells show a higher gene module score for the core inflammation program. Each cell has been scored for the enrichment of the core inflammation program genes compared to a random reference gene set of similar expression. Shown are control samples in gray alongside inflamed cells in orange. P-values were derived from a maximum likelihood ratio test of linear mixed models. Box plots: Median between the 25th and 75th percentile, whiskers extend to 10% and 90%. Outliers are shown as dots. Top plot: Statistics are derived from a total of 10,782 cells (Control: 1026, M/M: 5732, Severe: 4024) cells from N = 56 independent samples (PControl:M/M = 0.0109, PControl:Severe = 0.000013). Top mid: The experiment included a total of 48,875 cells (healthy: 12,338, G-CSF: 36,537) from N = 6 independent samples (PControl:G-CSF = 0.01416). Bottom mid: A total of 26,312 cells (Control: 4296, G-CSF: 5049, IFN-beta: 8472, IFN-gamma: 8495) from N = 4 independent samples were analyzed (PControl:G-CSF = 9.42 × 10⁻⁵, PControl:IFN-beta = 2.67 × 10⁻⁵, PControl:IFN-gamma = 2.71 × 10⁻⁵) Bottom plot: Calculation was performed on 26,239 cells (Control: 8990, E. coli: 17,249) from N = 10 independent samples (PControl:E. coli = 0.0376). c UMAP embedding. Coloring by gene set score (top panel) and the cell’s inflammatory state (bottom panel) shows an increase in the core inflammation program expression in inflamed samples compared to their control. Source data are provided as a Source Data file.

