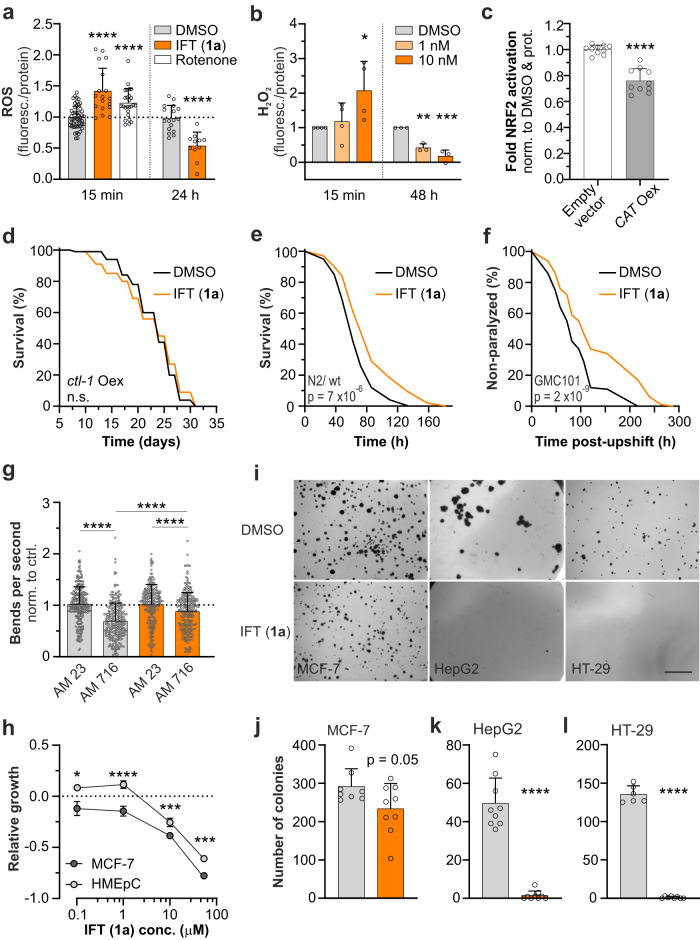
Fig. 5. Isofalcarintriol promotes oxidative stress resistance and targets age-related pathologies.
a DCF-DA and (b) AmplexRed determination of ROS dynamics in HepG2 (15 min DMSO n = 50; 15 min IFT: n = 18; 24 h DMSO: n = 17; 24 h IFT: n = 11 independent cell samples per condition) (15 min: p < 0.0001); 24 h: p < 0.0001) and C. elegans (15 min: n = 4; 48 h: n = 3 biologically independent samples per condition) (15 min: p = 0.018; 48 h: p = 0.002 for 1 nM and p = 0.0003 for 10 nM), respectively. c NRF2 luciferase reporter activation in cells overexpressing human catalase (CAT Oex) upon isofalcarintriol (1a) treatment (10 µM) compared to empty vector control (n = 10 independent cell samples per condition) (p < 0.0001). d Lifespan of ctl-1 (cytosolic catalase)-overexpressing nematodes. e Paraquat stress assay (10 mM paraquat) of C. elegans treated with isofalcarintriol (1a) (1 nM) compared to DMSO control. f Paralysis assay with GMC101 nematodes, a protein aggregation model of Alzheimer’s disease upon Isofalcarintriol (1a) treatment. g Motility assay with AM23 (control strain) and AM176 (CAG repeat strain) nematodes, as a protein aggregation model of Huntington’s disease (AM23 DMSO: n = 277; AM23 IFT: n = 258; AM716 DMSO: n = 276; AM716 IFT: n = 277 nematodes per condition in two independent experiments, p < 0.0001 for each comparison). h Proliferation assay with MCF-7 and its non-tumor control cells, HMEpC (MCF-7 0.1 and 50 µM: n = 6; MCF-7 1 and 10 µM: n = 3; HMEpC: n = 3 independent cell samples per condition) after 96 h treatment with of isofalcarintriol (1a) (0.1 µM: p = 0.01; 1 µM: p < 0.0001, 10 µM: p = 0.0006, 50 µM: p = 0.0005). i Soft agar colony formation assay. j MCF-7 (p = 0.05) (DMSO: n = 8; IFT: n = 9 independent cell samples per condition), k HepG2 (p < 0.0001) (n = 9 independent cell samples per condition), and l HT-29 (p < 0.0001) when treated with isofalcarintriol (1a) (DMSO: n = 6; IFT: n = 8 independent cell samples per condition). Scale bar: 1 mm. Data are represented as average or average ± SD or + SD. Data shown in (a), (b), (h), (i), and (j) were measured in ≥ 3 independent experiments. Statistics: log-rank test, two-sided unpaired student’s t-test, one-way ANOVA and Dunnett’s posthoc test, two-way ANOVA and Sidak’s post-hoc test. Source data are provided as a Source Data file.

