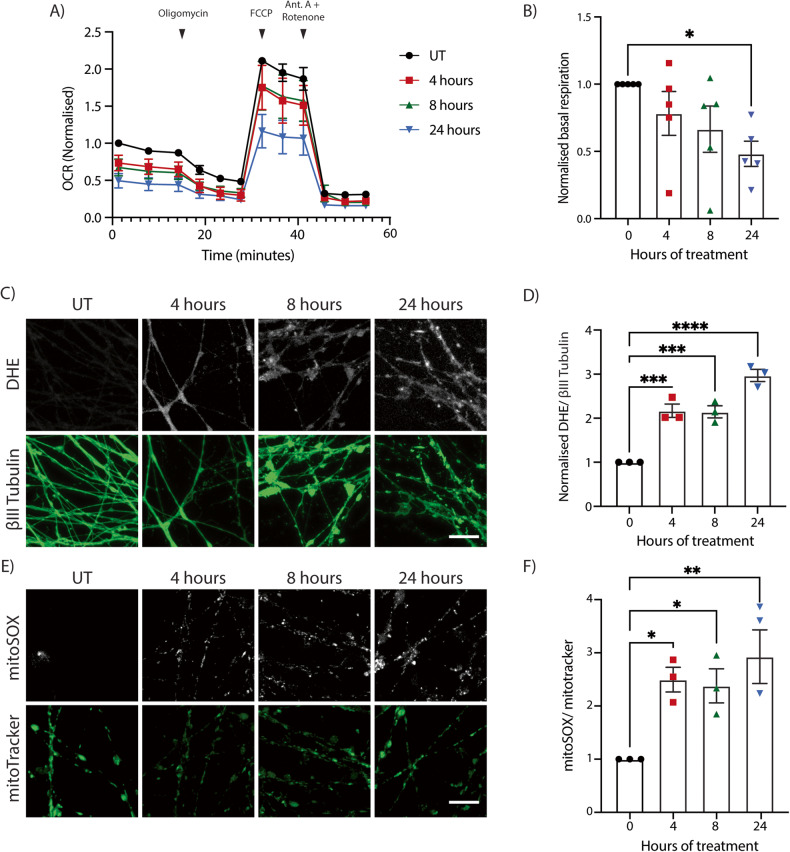
Fig. 2. Vincristine causes mitochondrial dysfunction and increased ROS in i3Neurons.
A Seahorse oxygen consumption rate (OCR) analysis of i3Neurons untreated (UT) or treated for 4, 8, and 24 h with 5 nM vincristine. Results normalized to UT i3Neurons. Results are represented as mean ± SEM. N = 5 independent differentiations, 3 wells measured per condition. Oligomycin (2 µM), FCCP (1 µM), and antimycin A/rotenone (500 nM) were added as indicated. B Basal OCR levels of i3Neurons UT and treated for 4, 8, and 24 h with 5 nM vincristine. Results normalized to UT i3Neurons. Results are represented as mean ± SEM. N = 5 independent differentiations, 3 wells measured per condition. One-way ANOVA, Bonferroni correction (p < 0.05 *). C Representative images of 5 nM vincristine-treated i3Neuron axons for ROS quantification. Staining with DHE (white) and βIII tubulin (green). Scale bar = 20 µm. D Quantification of DHE fluorescence in 5 nM vincristine-treated i3Neuron axons. Results normalized to untreated axons. Results are represented as mean ± SEM. N = 3 independent differentiations, 5–8 images per differentiation. One-way ANOVA, Bonferroni correction (p < 0.001 ***). E Representative images of 5 nM vincristine-treated i3Neuron axons for ROS quantification. Staining with MitoSOX (white) and MitoTracker Green (green). Scale bar = 20 µm. F Quantification of MitoSOX fluorescence in 5 nM vincristine-treated i3Neuron axons. Results normalized to UT axons. Results are represented as mean ± SEM. N = 3 independent differentiations, 5–8 images per differentiation. One-way ANOVA, Bonferroni correction (p < 0.05 *, p < 0.01 **).

