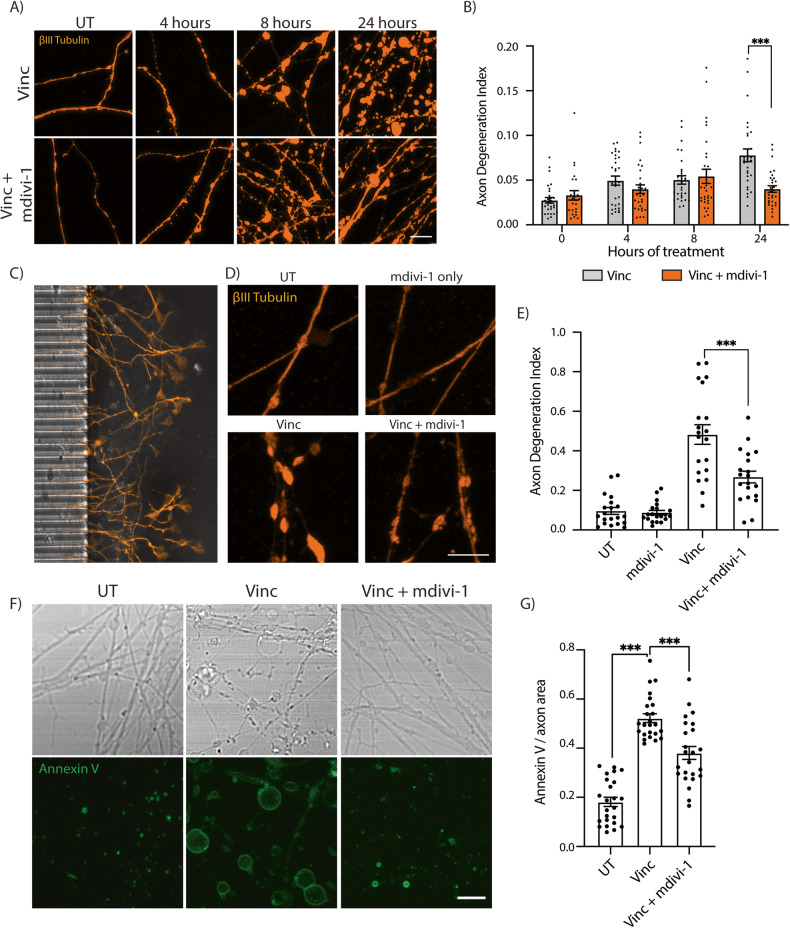
Fig. 3. Mdivi-1 delays vincristine-induced axonal degeneration.
A Representative images of i3Neuron axons treated with 5 nM vincristine or 5 nM vincristine + 50 µM mdivi-1. Immunostaining for βIII tubulin (orange). Scale bar = 10 µm. B Axon degeneration index for the experiments shown in (A). Results are represented as mean ± SEM. N = 3 independent differentiations, 10 images per differentiation. Two-way ANOVA, Bonferroni correction (p < 0.05 *) All other comparisons are not significant. C Image of the axon compartment of a microfluidic chamber used for isolation of axons and cell bodies, with the microgrooves for axons visible on the left. D Representative images of UT, 50 µM mdivi-1, 5 nM vincristine, and 5 nM vincristine + 50 µM mdivi-1 treated i3Neuron axons for 24 h in the microfluidic axonal compartment. Immunostaining for βIII tubulin (orange). Scale bar = 10 µm. E Axon degeneration index of the experiments shown in (D). Results are represented as mean ± SEM. N = 3 independent differentiations, 5–8 images per differentiation. One-way ANOVA, Bonferroni correction (p < 0.001 ***). F Representative brightfield and Annexin V stain images of UT, 5 nM vincristine, and 5 nM vincristine + 50 µM mdivi-1 treated i3Neuron axons for 24 h. Scale bar = 10 µm. G Quantification of Annexin V staining of UT, 5 nM vincristine, and 5 nM vincristine + 50 µM mdivi-1 treated i3Neuron axons for 24 h. N = 3 individual differentiations. N = 3 independent differentiations, 5–8 images per differentiation. One-way ANOVA, Bonferroni correction (p < 0.001 ***).

