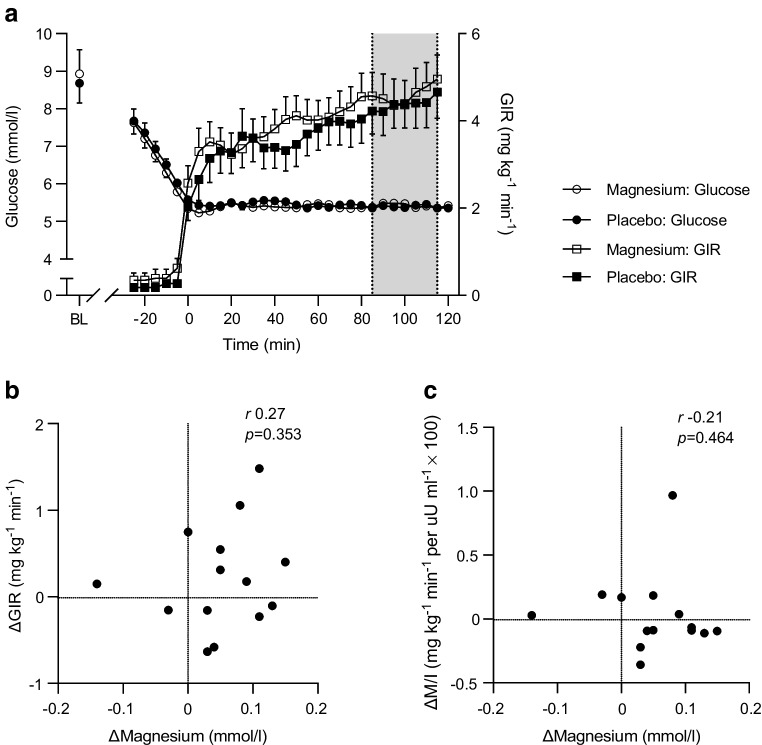
Fig. 1.
Time course of the plasma glucose concentration and GIR during the hyperinsulinaemic–euglycaemic clamp (a); the correlation between the change in serum magnesium concentration and the change in mean GIR (b); and the correlation between the change in serum magnesium concentration and the change in mean insulin sensitivity index (M/I) after magnesium supplementation compared with placebo (c). The grey area in (a) represents the last 30 min of the glucose clamp. Data are presented as mean ± SEM (n=14) (a) or individual values (b, c). BL, baseline

