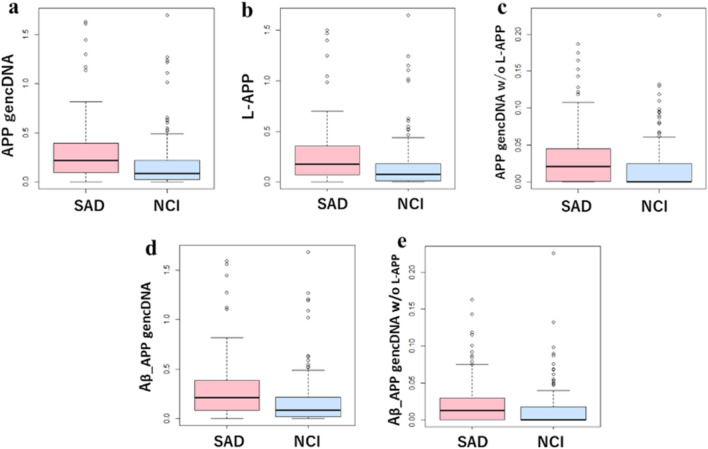
Figure 2.
Comparison of APP gencDNA read counts in SAD and NCI. All read counts were normalized by GAPDH read counts. (a) Total read counts of APP gencDNA. (b) Read counts of L-APP. (c) Read counts of APP gencDNA minus L-APP. (d) Total read count of Aβ-producible APP gencDNA. (e) Total read count of Aβ-producible APP gencDNA minus L-APP. p-values by the Mann–Whitney U test are (a) 5.14 × 10⁻⁶, (b) 5.54 × 10⁻⁶, (c) 8.81 × 10⁻⁵, (d) 6.19 × 10⁻⁶, (e) 1.04 × 10⁻³.

