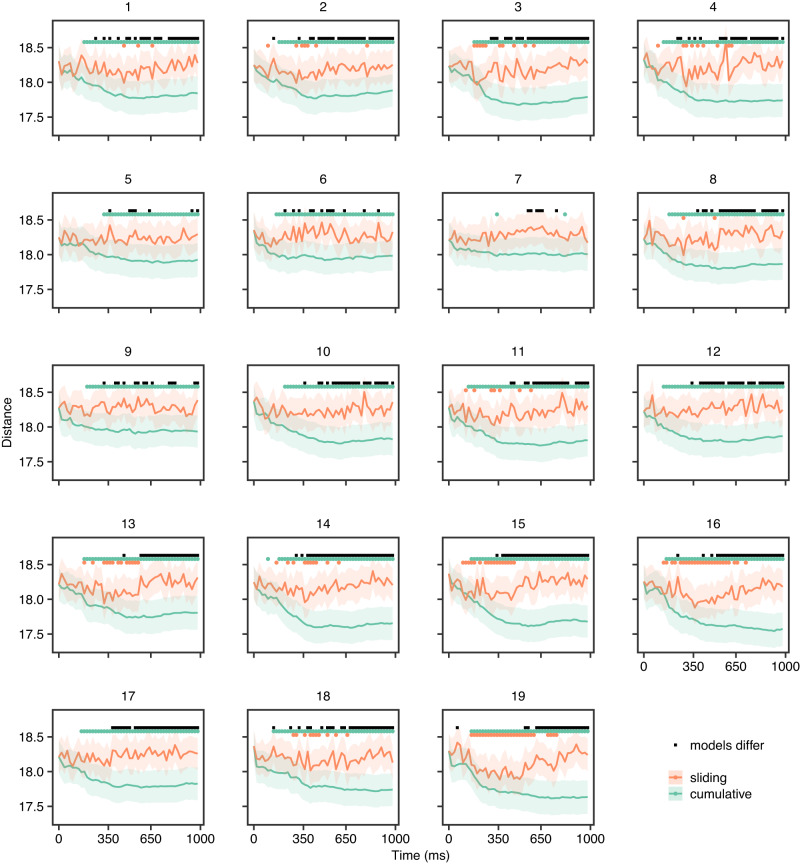
Fig. 4. Distance between predictions and targets over time in individual participants for semantic model.
The lines represent the mean across concepts, and the edges of the shaded areas indicate plus and minus one standard error. The dots above each line plot indicate time points with statistically significant differences (p < 0.05), based on permutation tests with 1000 permutations, FDR corrected). All participants displayed decreasing prediction-target distance as a function of time with an eventual plateau. Plateau points (for cumulative models) and troughs (for sliding fixed-length models) were defined as the time point after which prediction-target distance no longer decreased by more than 5%.

