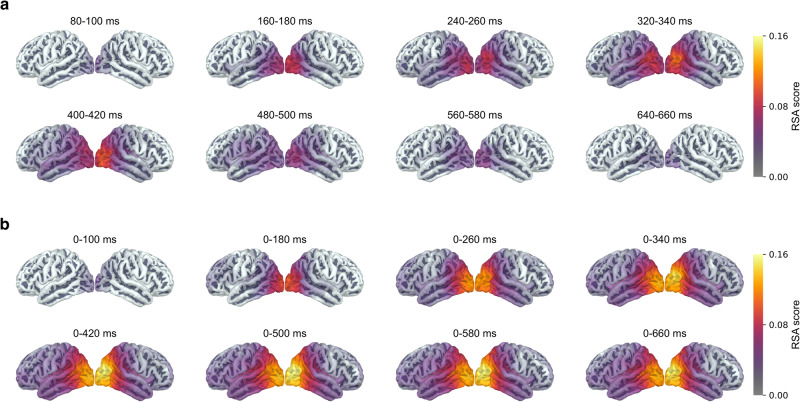
Fig. 8. RSA maps for the semantic feature model.
RSA maps illustrating the statistically significant clusters for different time windows, with a the sliding fixed-length approach and b the cumulative approach. For details on calculations of RSA scores see Methods. We used a cluster permutation test61 across participants with a cluster threshold of p = 0.01, a cluster-wide significance threshold of p = 0.05 and 5000 permutations in accordance with Hultén et al.38.

