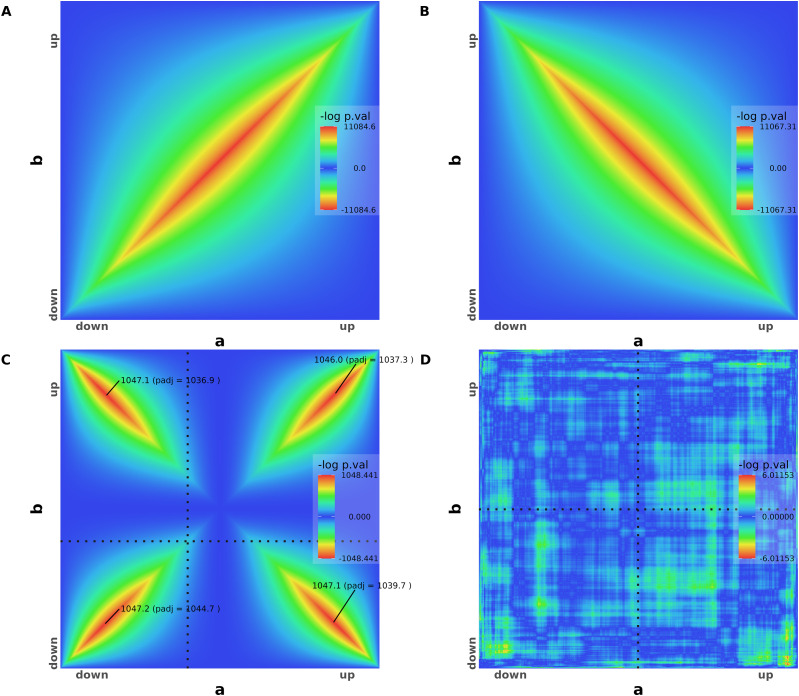
Figure 1. Rank–rank hypergeometric overlap (RRHO) for artificial datasets.
(A) RRHO map of two perfectly identical artificial gene expression lists a (on the x-axis) and b (on the y-axis). (B) RRHO map of two perfectly symmetrical lists with gene expression going in opposite directions. (C) Two lists with half of the genes going in the same direction and the other half in the opposite direction. The 96 permutation-adjusted P-values are reported. (D) RRHO map of two random gene expression lists. All adjusted P-values are below the significance threshold and therefore not shown (greater than 3 ≈ −log[0.05]).

