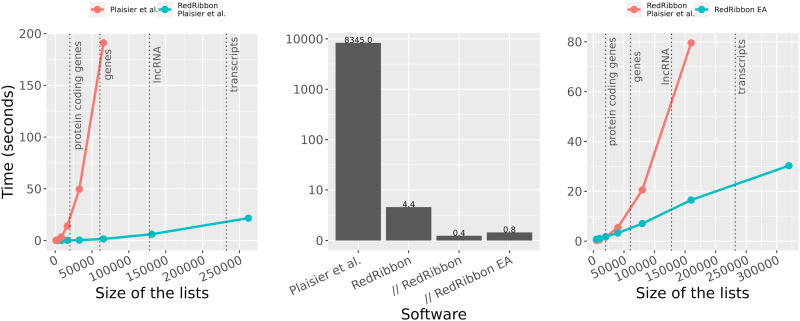
Figure 2. RedRibbon allows performing gene, lncRNA, and transcript analyses.
RedRibbon was compared with Plaisier et al (2010). The vertical dotted lines delimit the typical list lengths for gene, lncRNA, and transcript analyses. Left: time to compute the minimal P-value for lists of n elements with a step size of sqrt(n) with the Plaisier et al (2010) grid method compared with our re-implementation of this method using the same parameters. Center: comparison of our P-value permutation method with Plaisier et al (2010) for 5,000 elements and a step size of 50. Time according to Plaisier et al (2010) is reported and corrected for CPU performance improvement (single thread performance on https://www.cpubenchmark.net/). RedRibbon time is reported in single thread (RedRibbon), multithreads (// RedRibbon), and multithreads with the evolutionary algorithm (// EA RedRibbon). Right: time to compute the minimal P-value of n elements with a step size of sqrt(n) with permutation P-value correction. Our re-implementation of the Plaisier et al (2010) grid algorithm is compared with the new evolutionary algorithm that has no step size limitation and hence higher accuracy.

