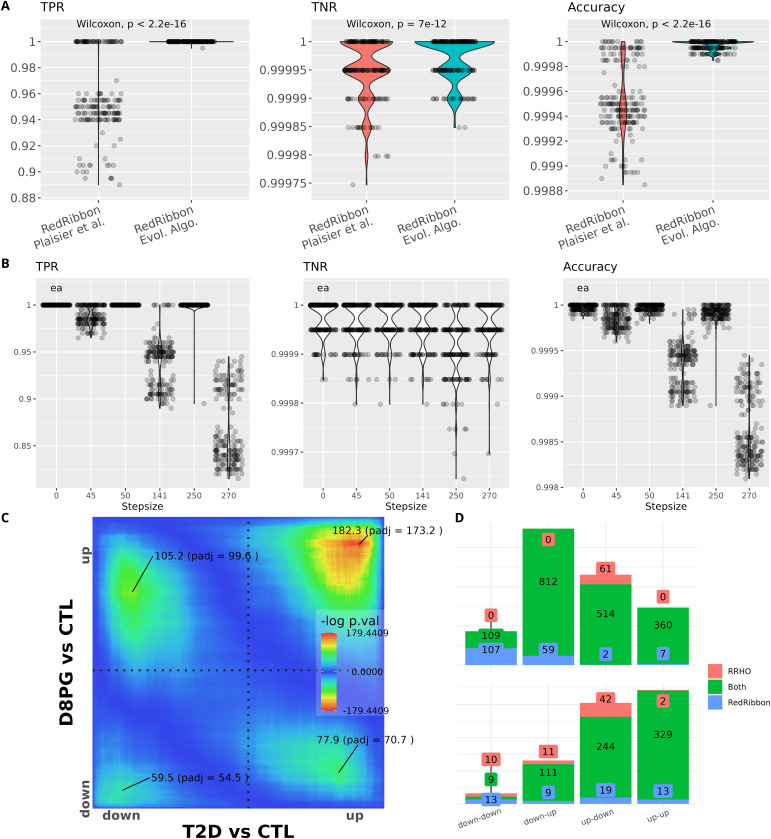
Figure 3. RedRibbon allows performing overlap analyses with high accuracy.
(A) Violin plots for 192 artificial datasets (see the synthetic gene sets and accuracy measurements section). The remaining genes are randomly ranked. True positive rate (TPR), true negative rate (TNR), and accuracy are reported. TPR and accuracy are significantly better for evolutionary algorithms than with the classic grid method. (B) TPR, TNR, and accuracy for the evolutionary algorithm (ea) compared with the grid method for increasing step sizes. The 141-step size is the default value for grid method. (C) RedRibbon hypergeometric map of 16,547 genes comparing human islets isolated from type 2 diabetic (T2D) versus nondiabetic (CTL) donors and human islets recovering from palmitate + glucose exposure in vitro (D8PG versus CTL), as in Marselli et al (2020). (D) Comparison of the original rank–rank hypergeometric overlap algorithm with default step size (128 genes, red) with RedRibbon (blue). Green shows elements detected with both methods. Top figure shows the overlapping gene counts, bottom figure pathway enrichment counts.

