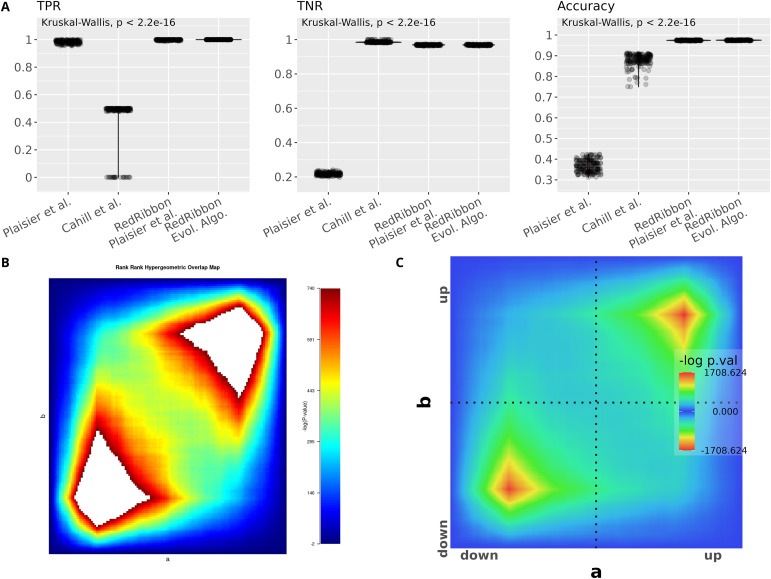
Figure S1. Accuracy tests reveal bugs in the original Rank–Rank Hypergeometric Overlap R package.
(A) True positive rate, true negative rate and accuracy for simulation with 192 synthetic sets of two lists of 19,962 genes with 1,500–2,500 overlapping genes among the top 3,500–4,500 genes. (B) The logarithm bug. When the P-value is too small for double machine representation, the P-value is rounded to 0. The original rank–rank hypergeometric overlap R package takes the logarithm of this P-value, leading to an infinite value. The left overlap map illustrates the issue with two lists of 19,962 with 2,000 overlapping genes among the top 4,000 genes: infinite values lead to large white patches on the plot. This revealed another bug: the minimal P-value coordinate is erroneous in case of multiplicity. Multiplicity happens when the P-values underflow to 0 (white patches in the left plot) but also when two P-values are close, below the accuracy of double numbers (not shown). (C) The overlap map generated by RedRibbon for the same data.

