
FIGURE 1.
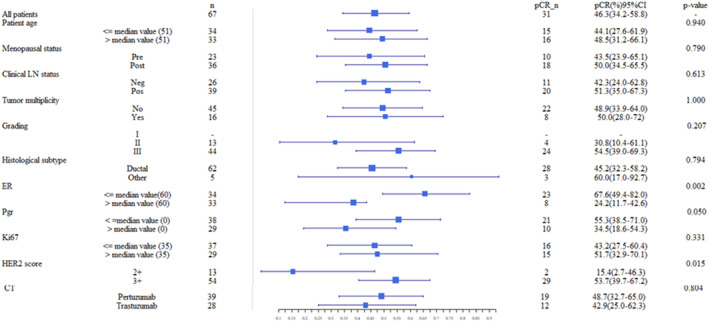
Forest plot of pathologic Complete Response (pCR). pCR and relative 95% Confidence Interval (CI) was calculated for several characteristics. The statistical tests used to study the significance of variables respect to pCR are Fisher's exact test for categorical variables. A result was considered significant when the p‐value was less than 0.05.