FIGURE 5.

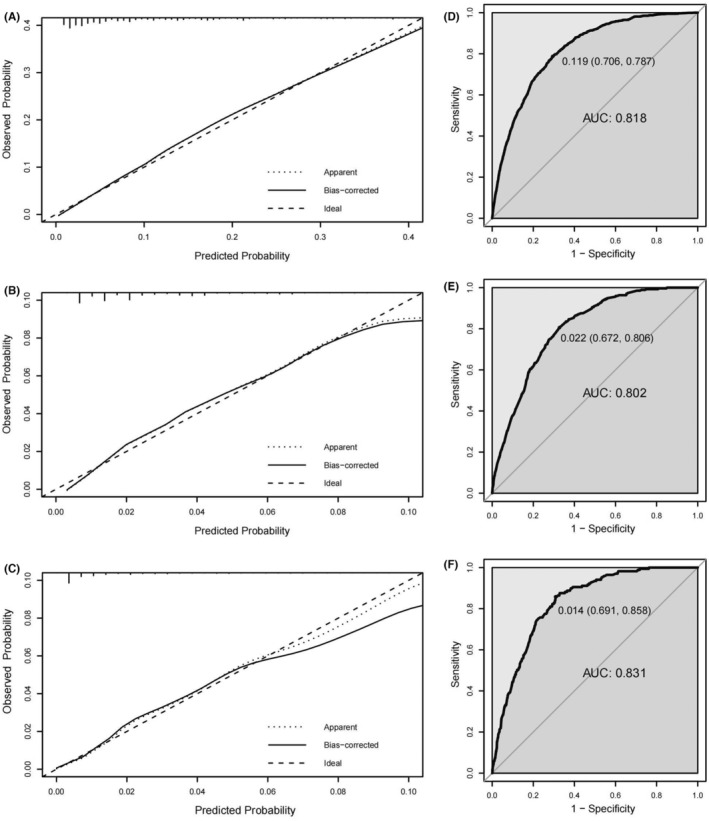
The calibration curves and ROC curves for evaluating the calibration and discrimination of the nomograms of development cohort in predicting synchronous liver metastasis (A, D), lung metastasis (B, E), and hepato‐lung metastases (C, F).

The calibration curves and ROC curves for evaluating the calibration and discrimination of the nomograms of development cohort in predicting synchronous liver metastasis (A, D), lung metastasis (B, E), and hepato‐lung metastases (C, F).