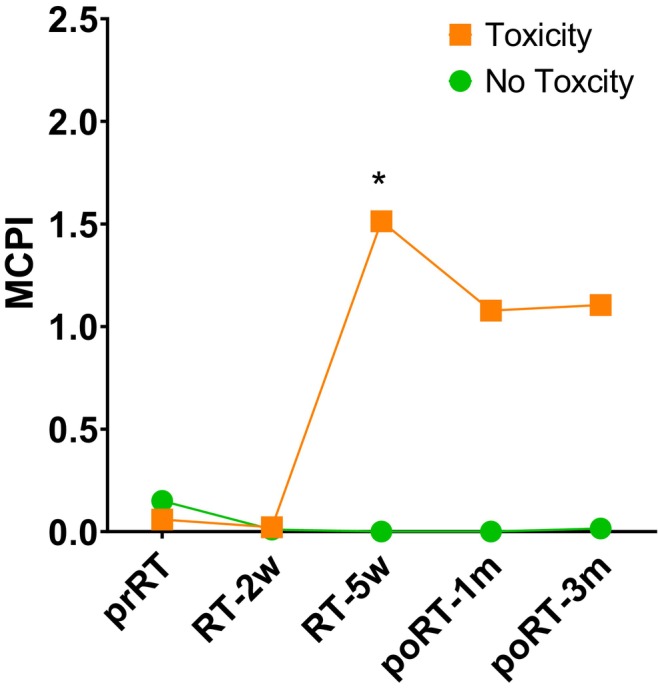
FIGURE 3.

The change in RT‐related MCPI based on the family level of taxa, according to the presence of toxicity. Asterix represents that p value was less than 0.05. RT, radiation therapy; MCPI, microbial community polarization index; prRT, pre‐RT; RT‐2w, 2 weeks after the start of RT; RT‐5w, 5 weeks after the start of RT; poRT‐1 m, 1 month after the end of RT; poRT‐3 m, 3 months after the end of RT.
