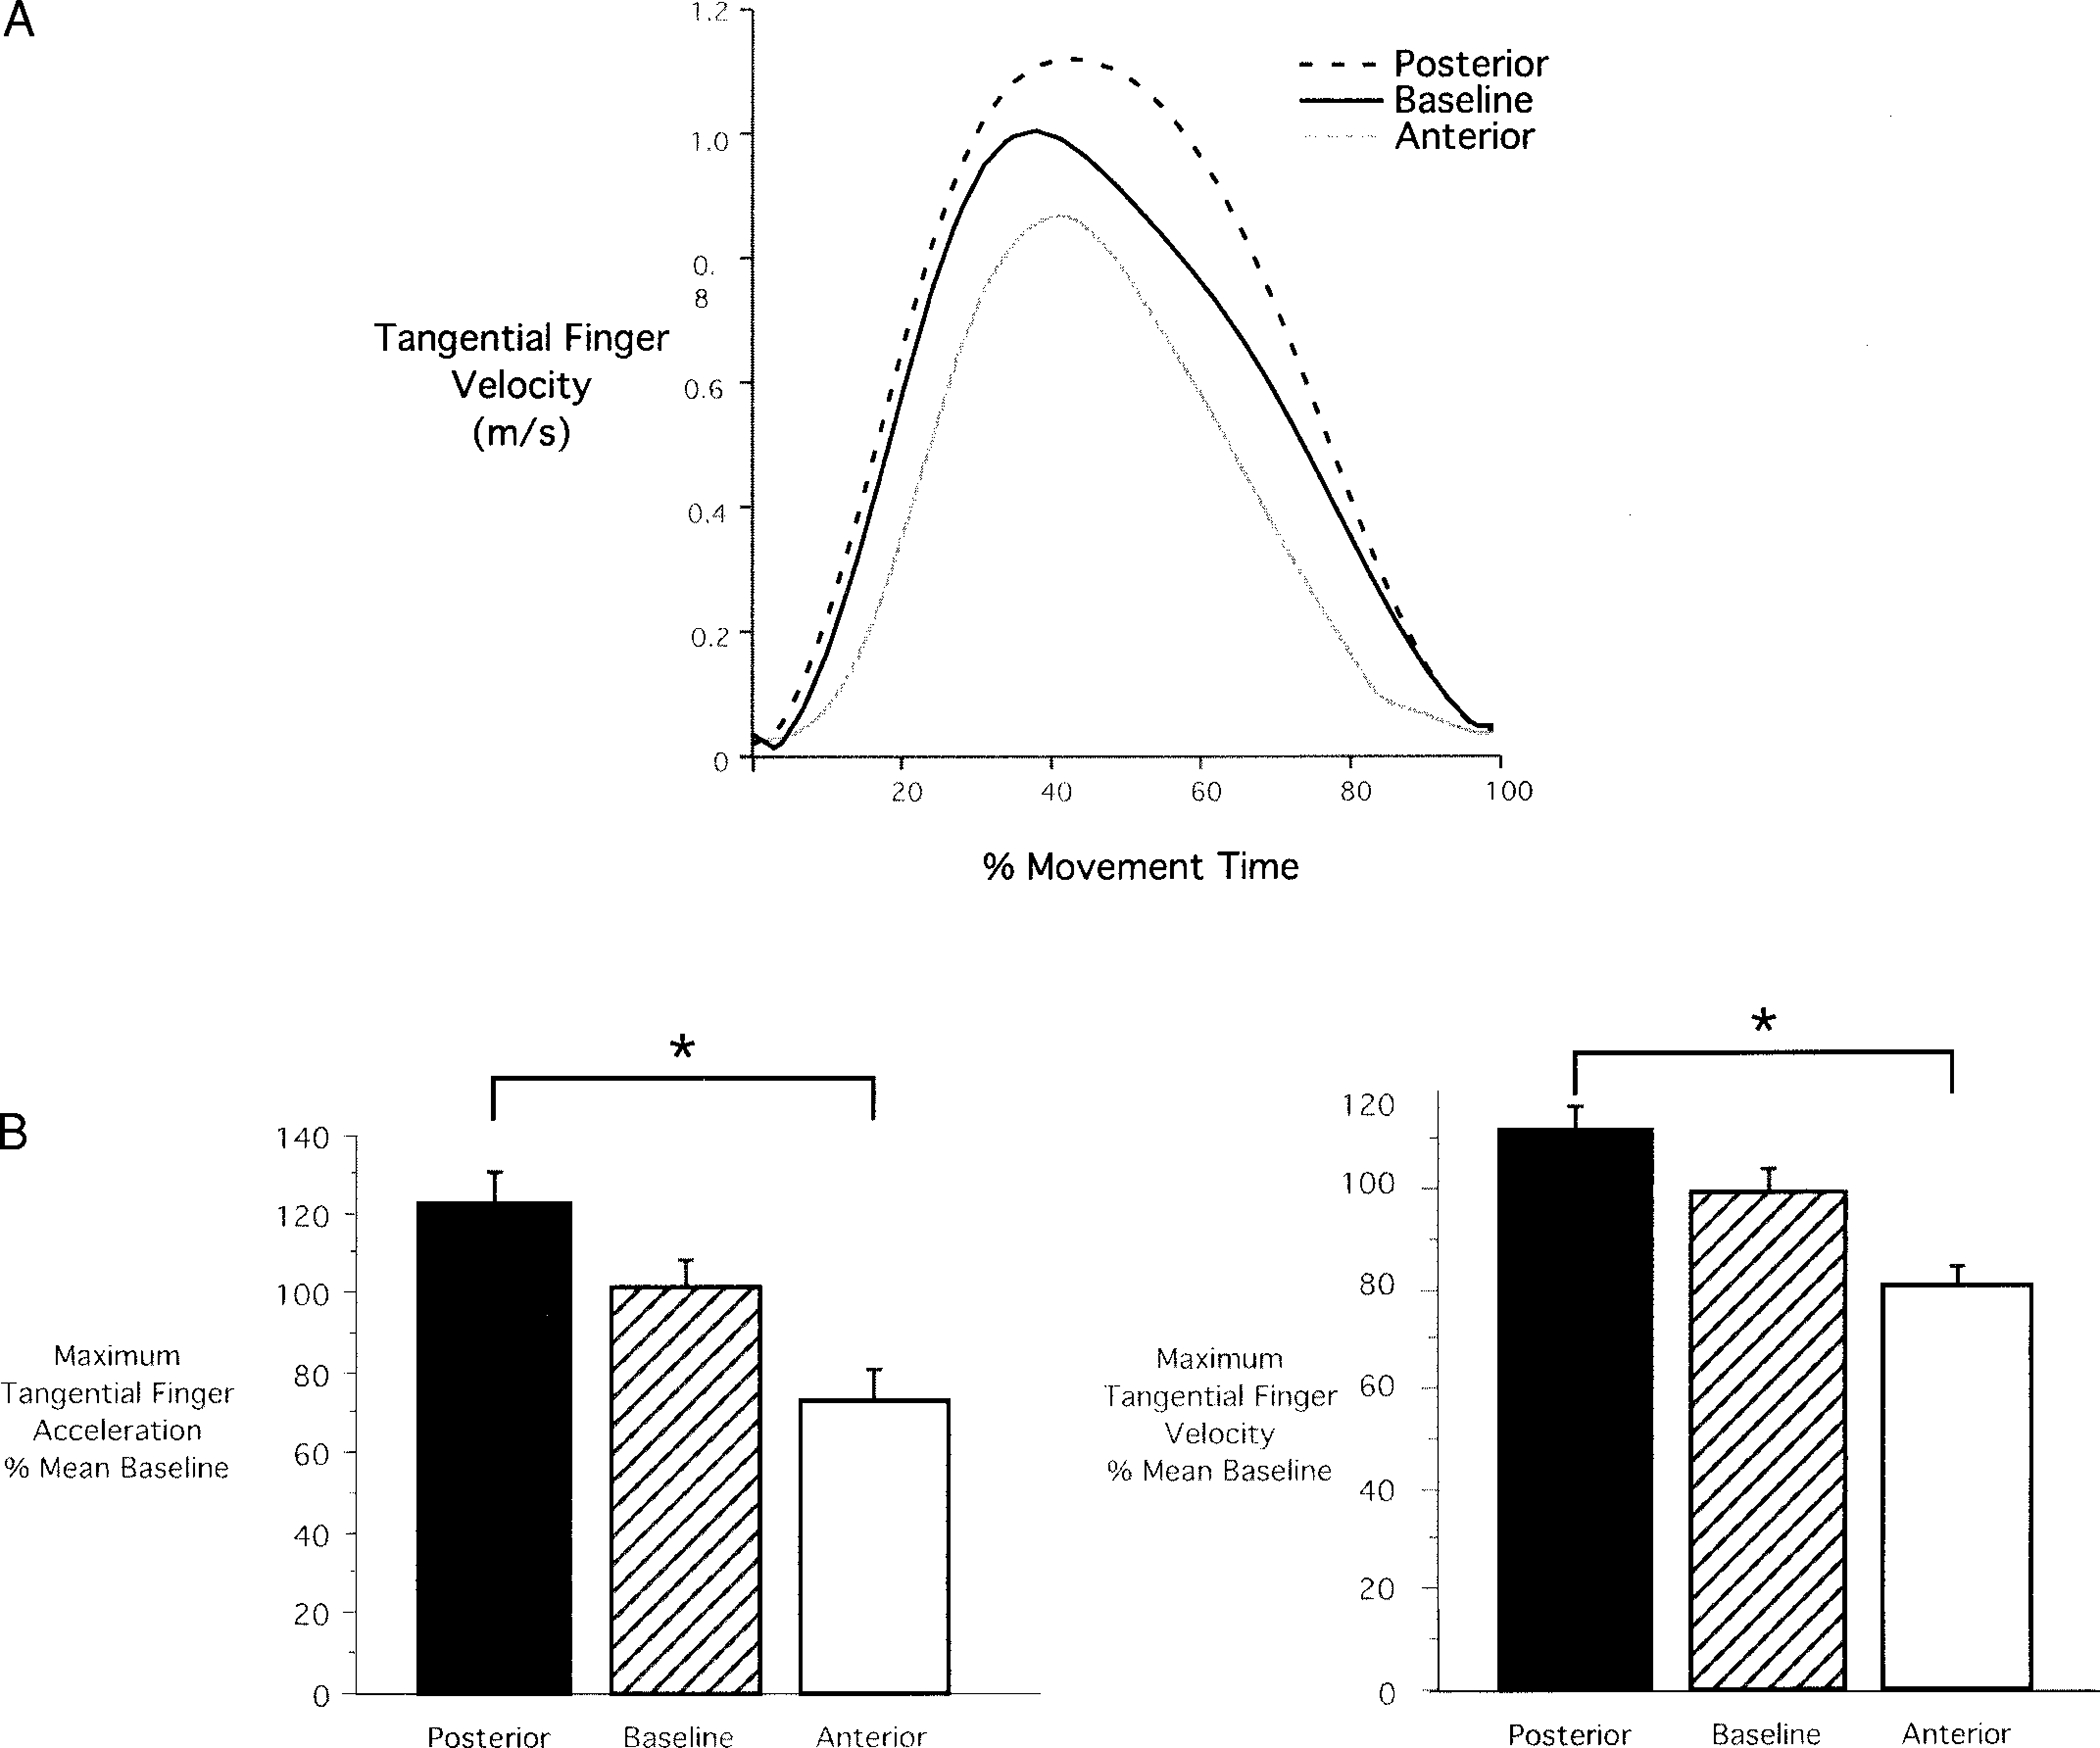
FIG. 5.

Tangential velocity and acceleration. A: sample velocity profiles for baseline (black), anterior (gray), and posterior (dashed) movements. Profiles are fairly symmetrical and bell shaped. Peak amplitude can be seen to vary with required movement distance. B, left: average (mean ± SE) tangential acceleration for anterior, baseline, and posterior start locations. Right: average tangential velocity for anterior, baseline, and posterior start locations. Values have been normalized to mean peak acceleration and velocity, respectively.
