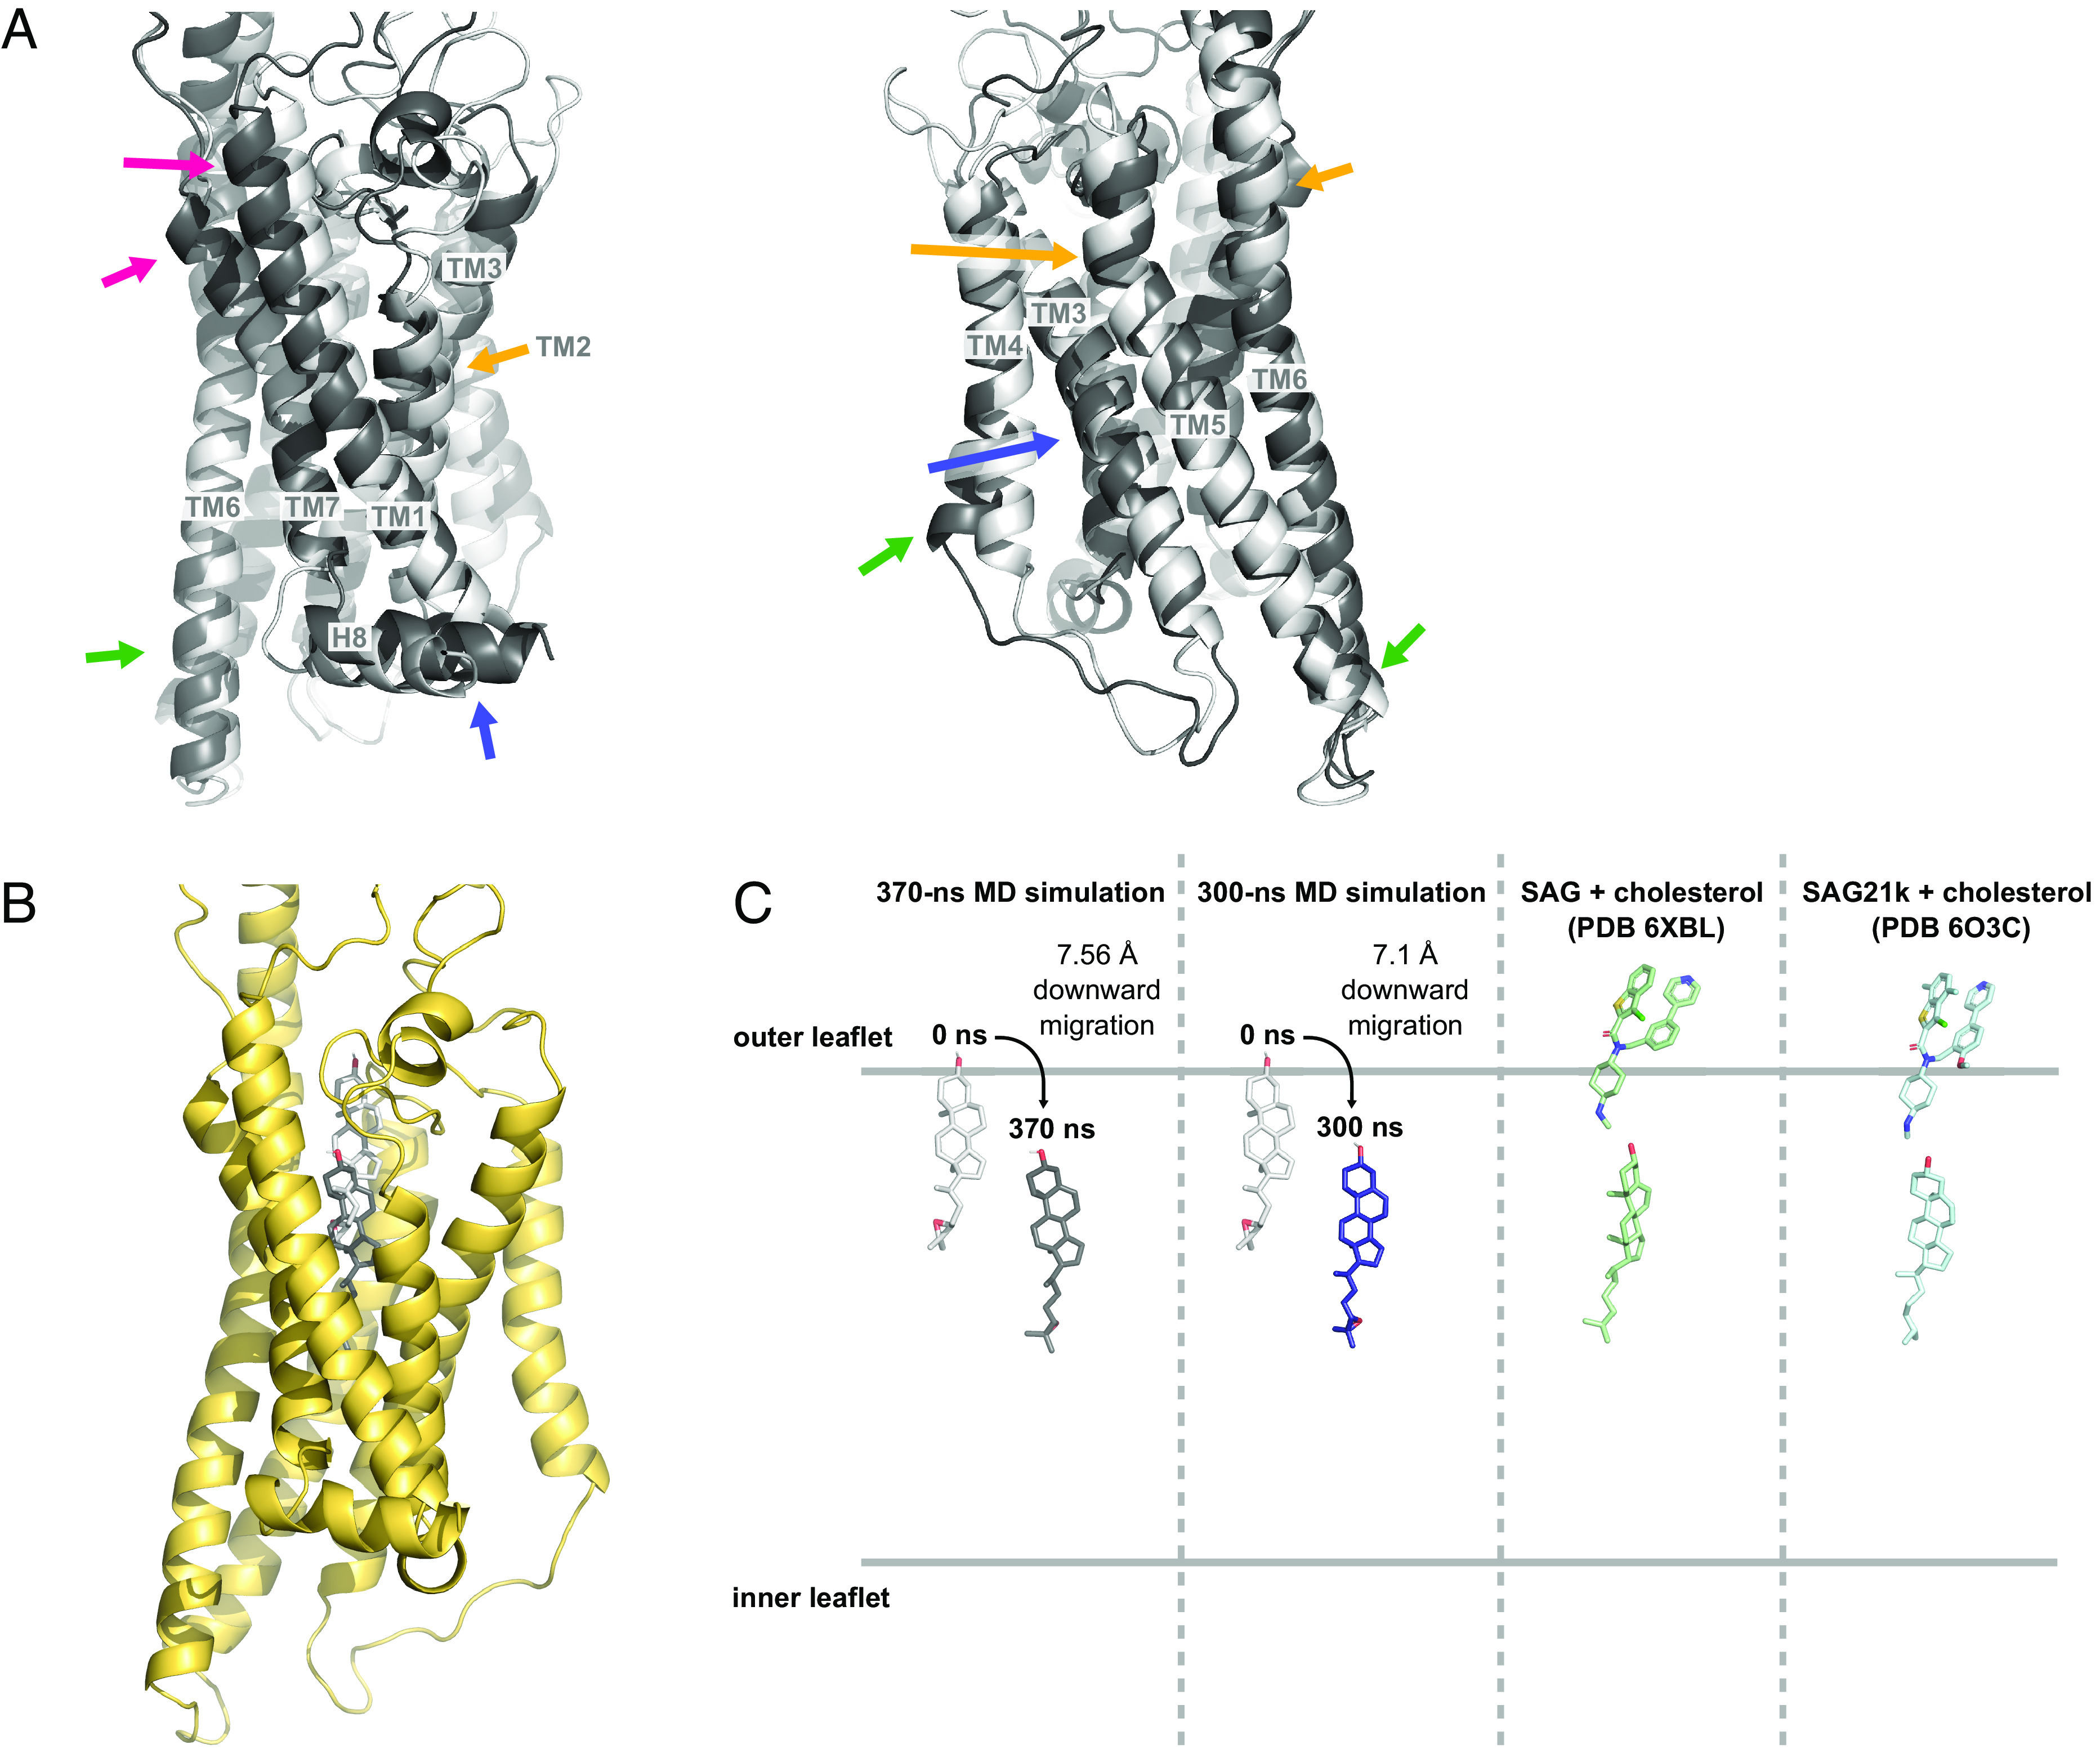
Fig. 3.

Repositioning of the TMD and downward migration of a sterol ligand. (A) Comparison of the TMD between the initial (0 ns, white) and final structure of the SMO–ligand–Gi complex (370 ns, dark gray). Colored arrows correspond to movements described in the text. (B) Position of 24(S),25-epoxycholesterol (CO1) in the initial (0 ns, white) and final structure (370 ns, dark gray). (C) Locations of CO1 in the initial and final computed structures in two independent MD simulations (0 ns, light gray; 370 ns, dark gray; 300 ns, navy) compared to the positions of SAG/SAG21k and cholesterol in cryo-EM structure (6XBL, green) and crystal structure (6O3C, blue).
