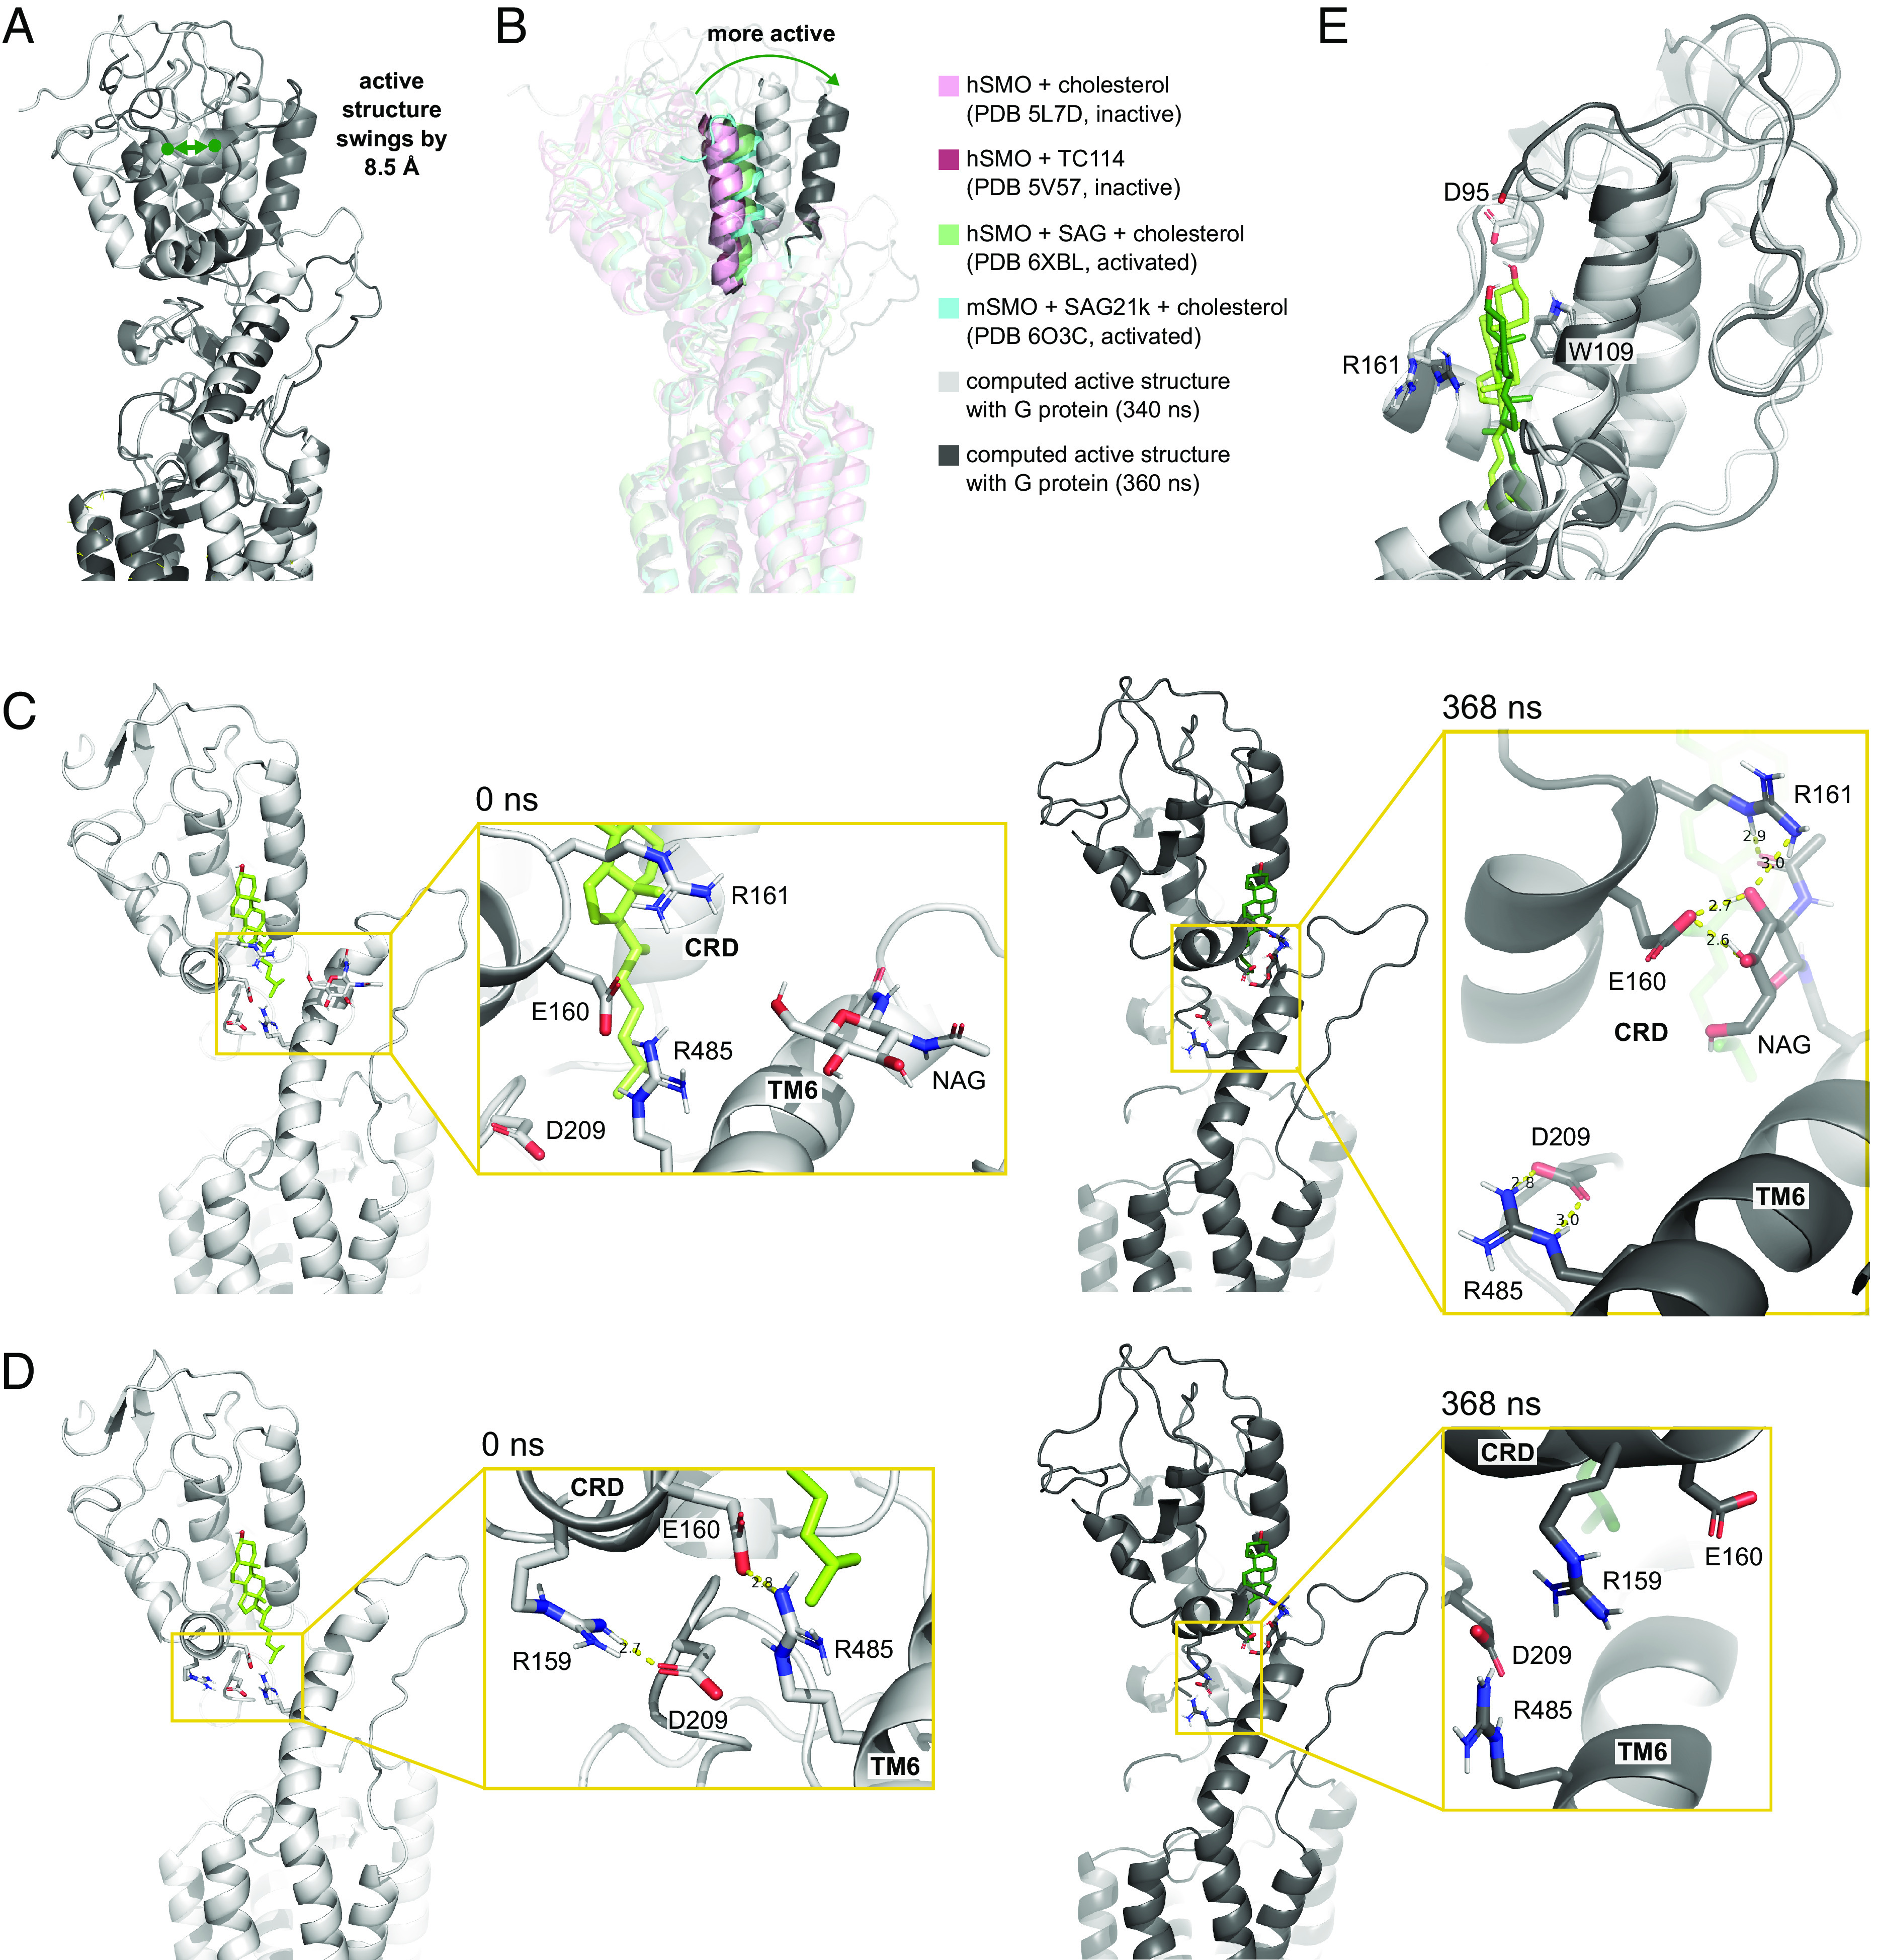
Fig. 4.

CRD movements and interactions with the LD and TMD. (A) Comparison between the computed SMO structure at 340 (white) and 360 ns (dark gray). (B) A representative CRD helix showing the relative positions of the computed structures (340 ns, light gray; 360 ns, dark gray), inactive (PDB 5L7D, light pink; PDB 5V57, dark pink), and active (PDB 6XBL, green; PDB 6O3C, blue) experimental structures. (C) Exchange of salt bridges between the CRD and residues in the TMD and LD during CRD motion. (D) Weakening of an interaction between D209LD and R159CRD and breaking of the interaction at E160CRD and R4856.66 between the initial (0 ns, light gray) and final structure (370 ns, dark gray). (E) Comparison of CRD-cholesterol interactions between the initial (0 ns, light tint) and final structure (370 ns, dark tint).
