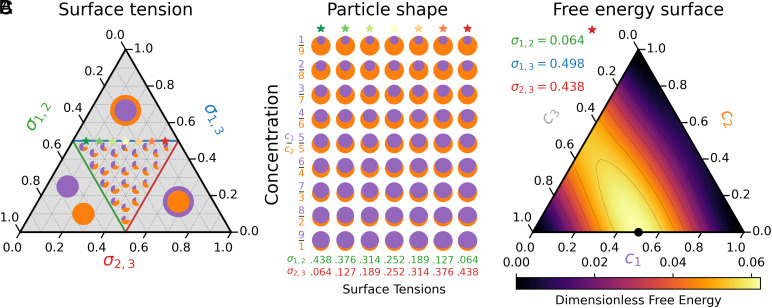
Fig. 2.
(A) Possible contact angles as a function of relative surface tensions . Wetting occurs if any surface tension dominates the other two (the Top, Left, and Right subtriangles of ternary diagram). (B) Example minimal energy configurations for varying surface tensions (horizontal axis) and relative concentrations (vertical axis). Surface tensions are chosen so that . The surface tensions of each column are indicated in the ternary plot with stars shifting from green () to red (). (C) The free energy used in simulations of experiments. The maximum is located at the black circle. The energy is more sensitive to than or .

