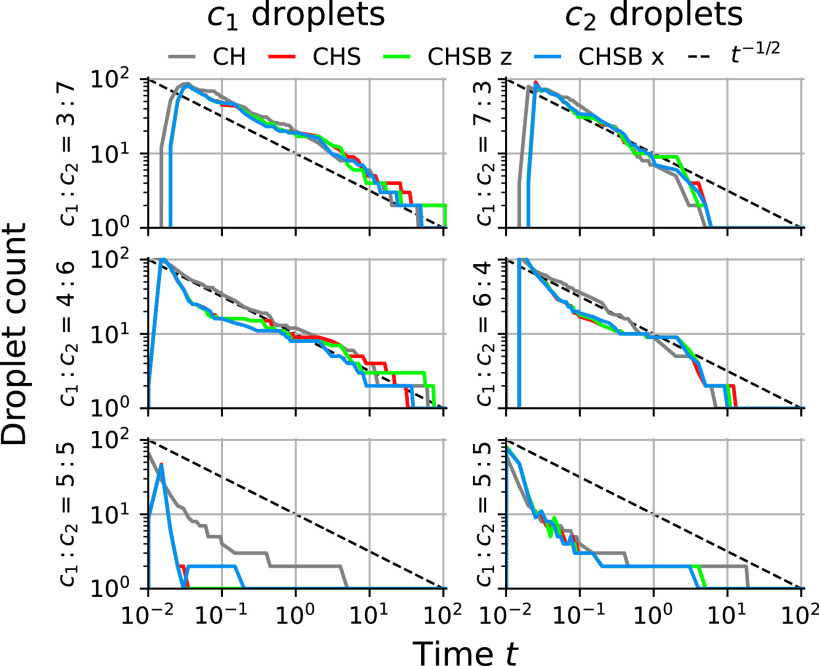
Fig. 5.
Plot of number of droplets (Left column) and droplets (Right column) over time, for different concentration ratios : , for CH (gray), CHS (red), CHSB (green), and CHSB models (blue). A line (dashed black) fits some coalescence regimes well. The CHS, CHSB z, and CHSB models show very little difference in particle counts. The CH model is similar for concentration ratios : of 3 : 7 and 7 : 3 but becomes increasingly distinct as the concentration ratio approaches 5 : 5. Droplet counts are omitted for other choices of droplet and concentration ratio because at most one drop ever forms.

