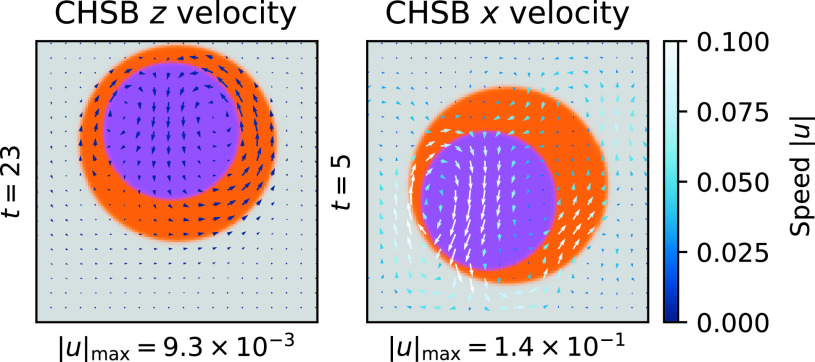
Fig. 7.
Example snapshots of the velocity field for the 2D CHSB (Left) and CHSB (Right) models. Both simulations have an initial concentration ratio : = 0:5. The phases are illustrated in color (, , are purple/orange/gray) and the velocities indicated with arrows (colored by speed). The time of each snapshot is provided on the left of each axis, and the maximum speed indicated on the Bottom. The CHSB x model has been shifted into the droplet frame, and we have subtracted off the -averaged velocity profile to visualize the deviation from Poiseuille-type shear flow. The length scales of the velocities in each figure are different; however, both are colored according to the same velocity scale (Right).

