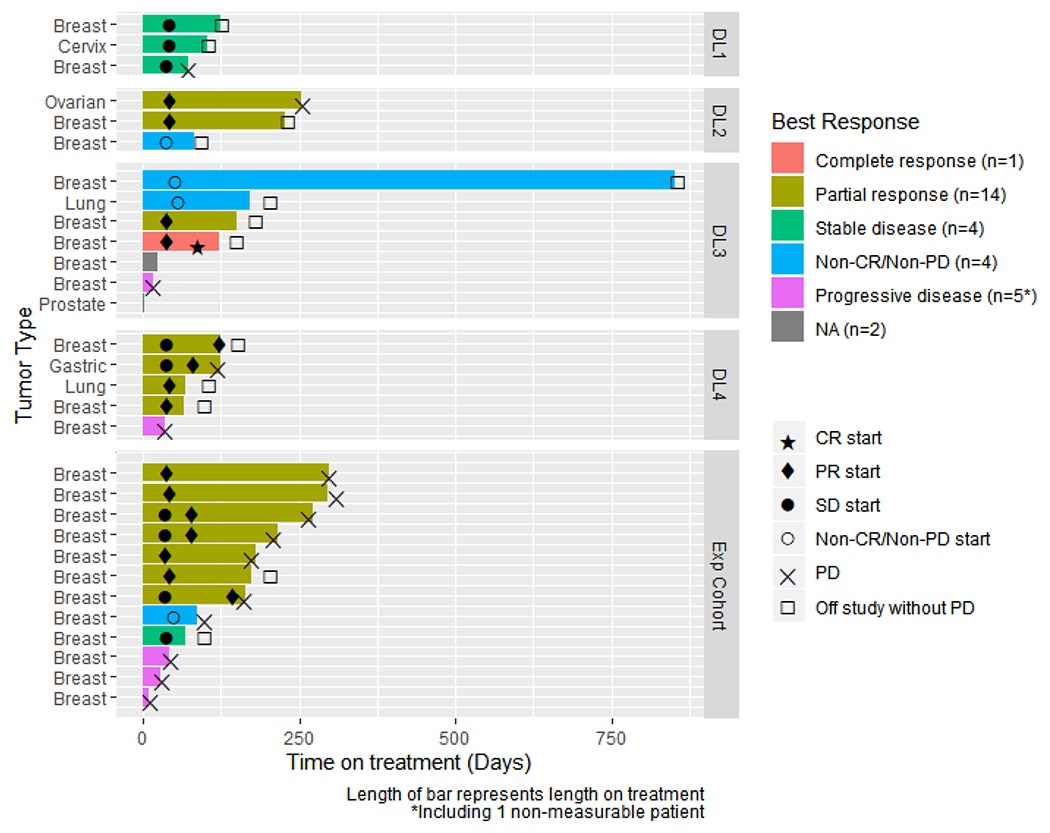
Figure 3.

Swimmers plot representing the time on treatment and the response status. Duration of treatment and response in patients treated with veliparib combined with paclitaxel and carboplatin. Time on treatment is plotted for patients with RECIST and responses. One patient transitioned to single-agent veliparib via expanded access after cycle 38. Two patients were not evaluable (NA) for response. Symbols indicate the initiation of clinical benefit/response as indicated in the figure key. Progressive disease (PD) is indicated by an “X”, while an off-study event unrelated to PD is indicated by an open box.
