
Figure 4.
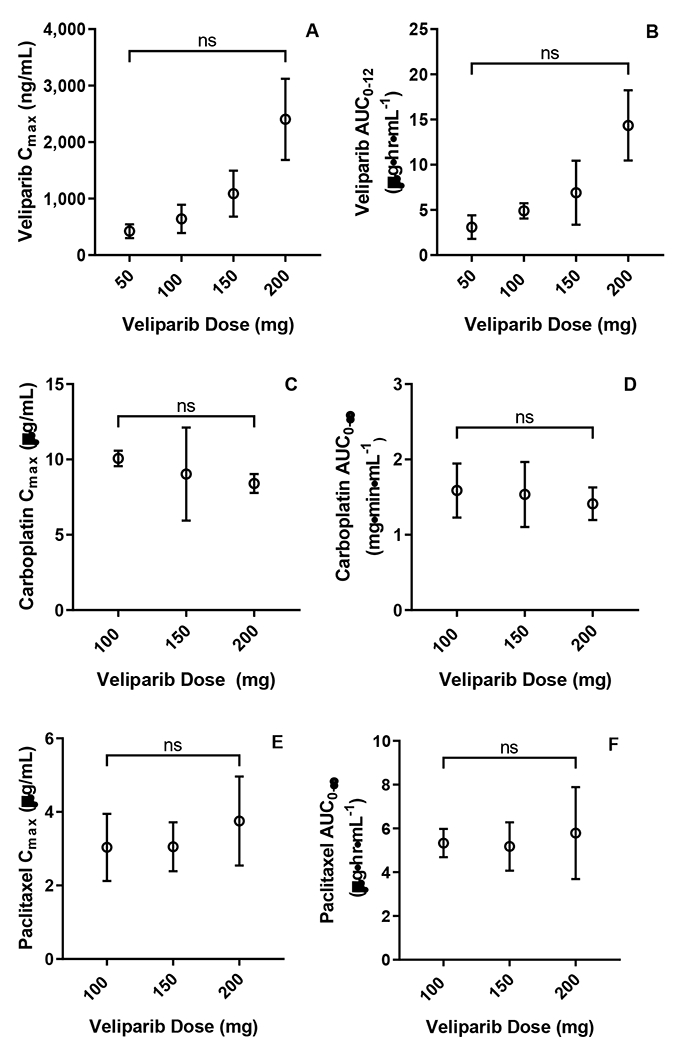
Pharmacokinetics. (A) Veliparib Cmax across investigated dose levels (p-value from ANOVA testing of dose-normalized Cmax = 0.055). (B) Veliparib AUC0-12 across investigated dose levels SD (p-value from ANOVA testing of dose-normalized AUC0-12= 0.284). (C) Carboplatin Cmax across investigated veliparib dose levels (p-value=0.670). (D) Carboplatin AUC0-∞ across investigated veliparib dose levels (p-value=0.757). (E) Paclitaxel Cmax across investigated veliparib dose levels (p-value 0.431). (F) Paclitaxel AUC0-∞ across investigated veliparib dose levels (p-value 0.554). All points represent mean PK parameter and error bars represent SD.