
Fig. 3.
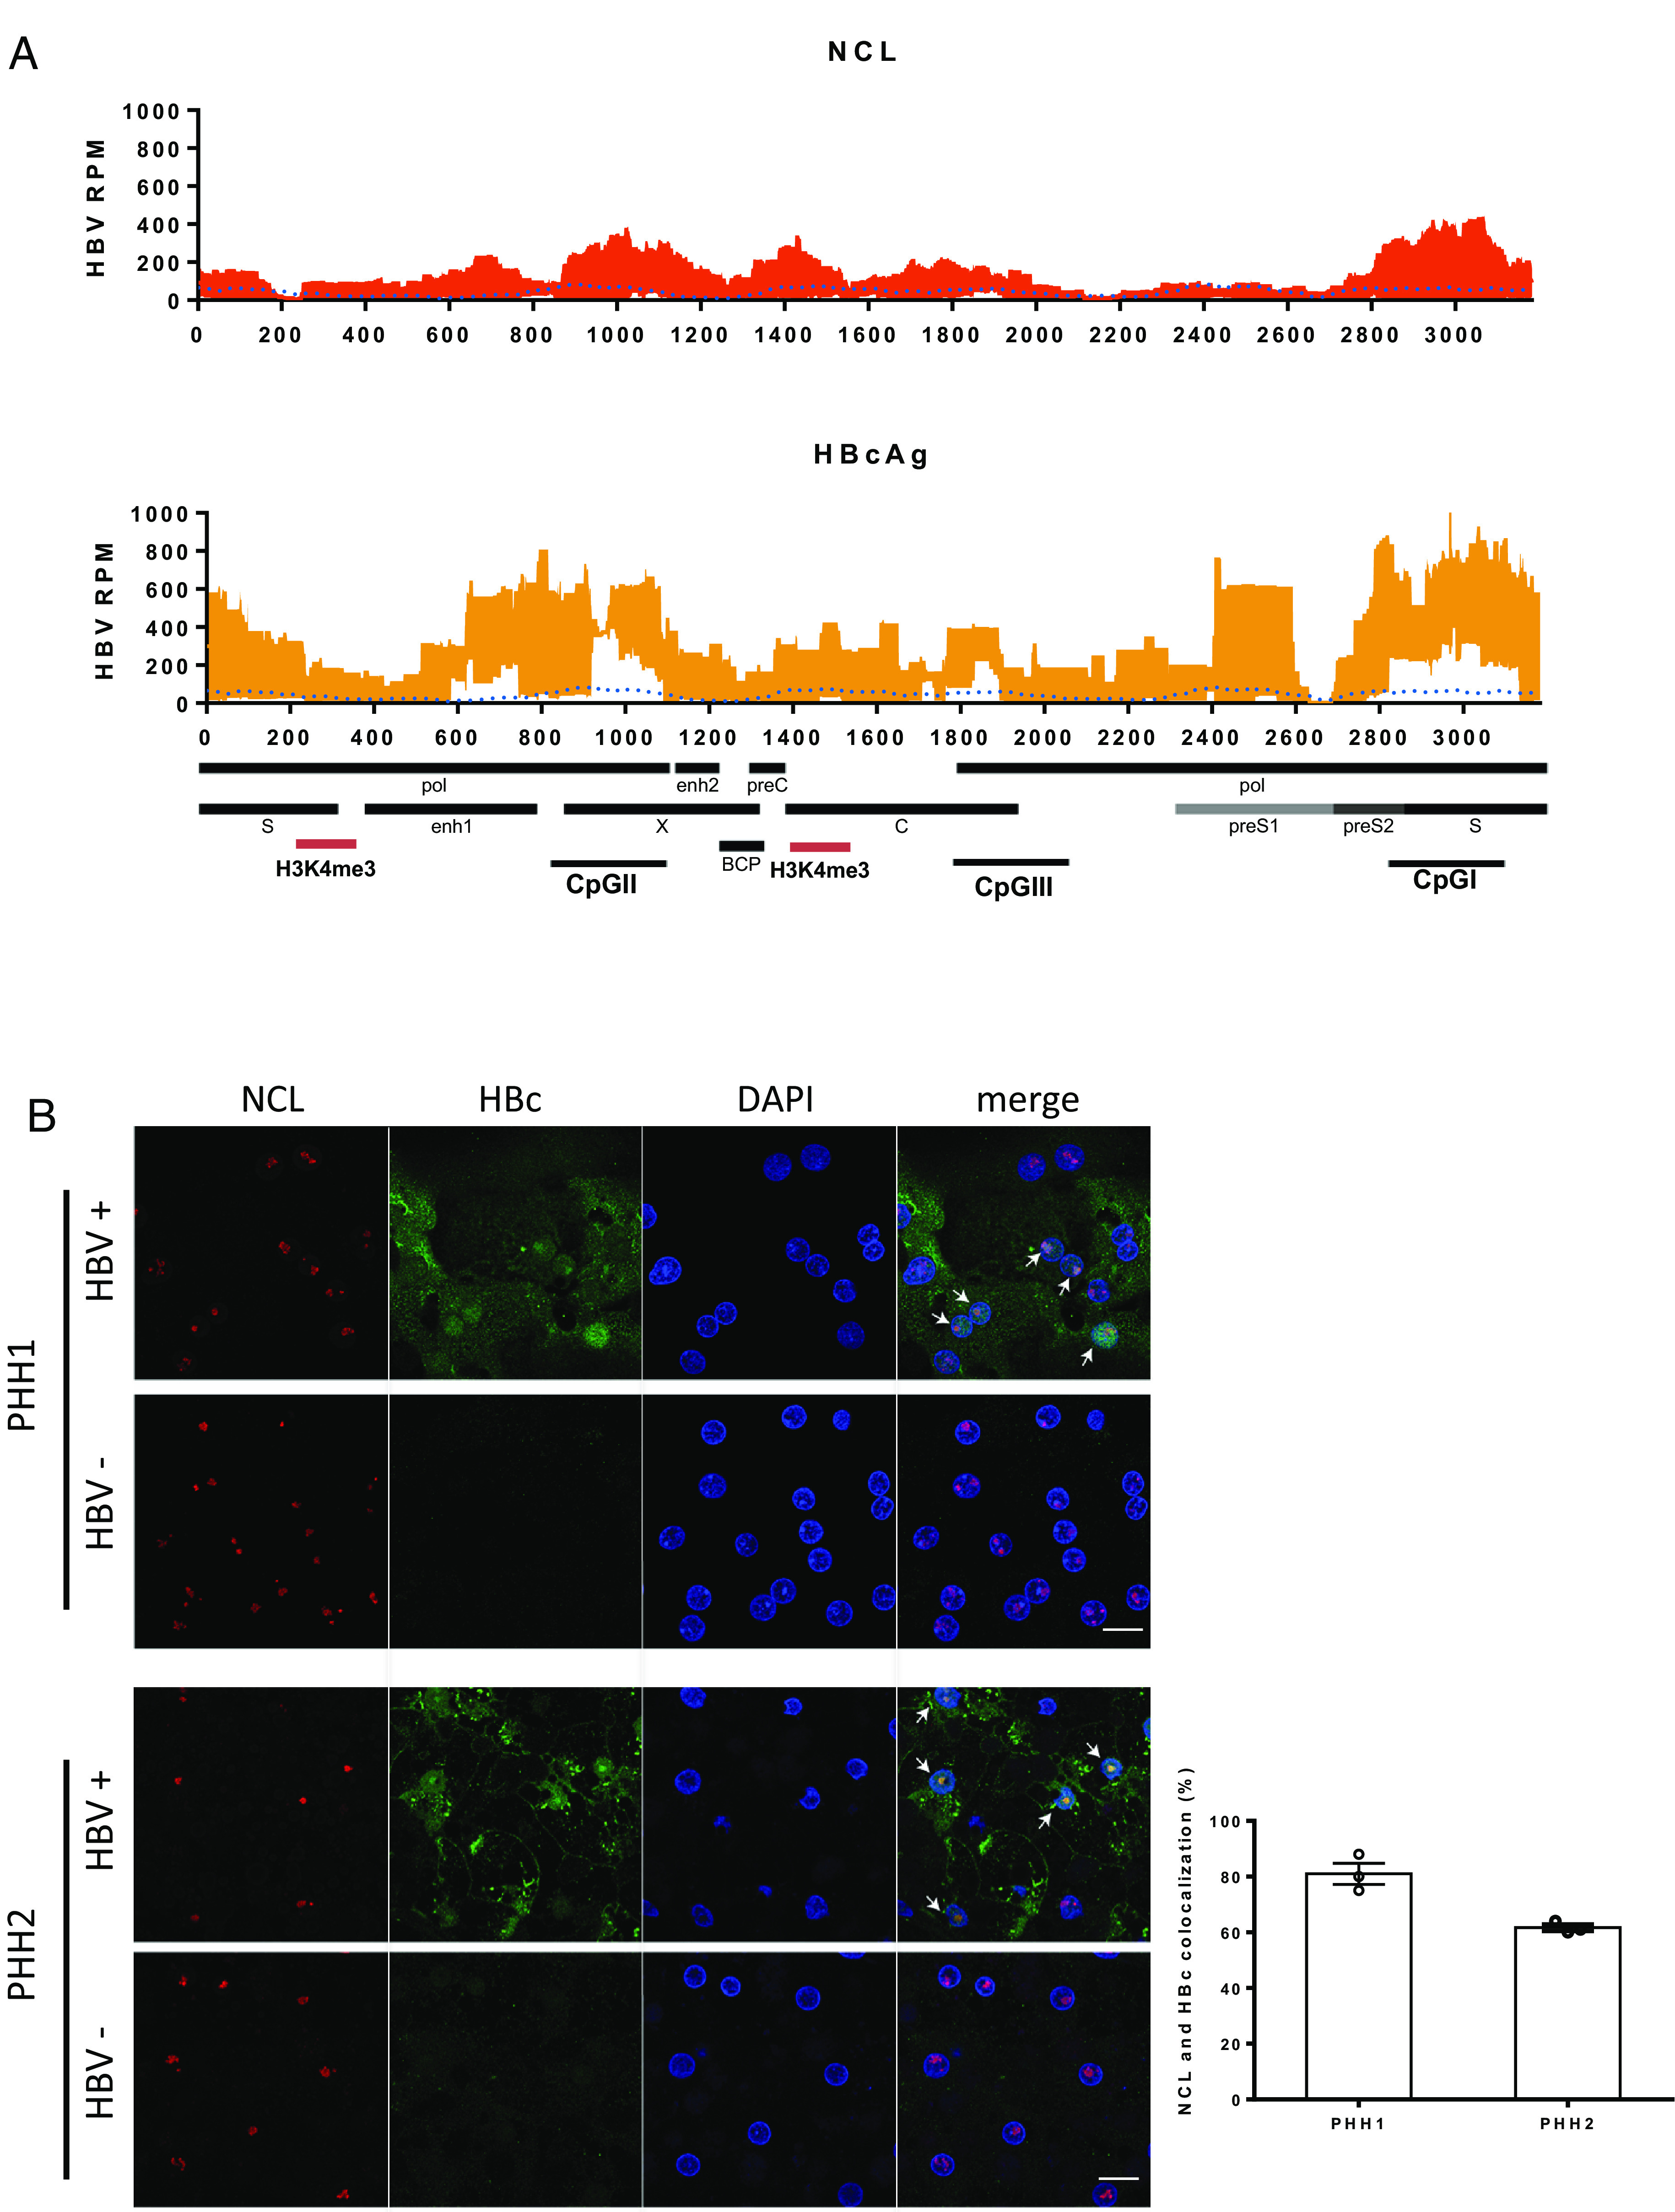
Distribution of nucleolin on cccDNA and in HBV-infected cells. (A) Distribution of nucleosomes and protein binding sites were determined by cccDNA ChIP sequencing across the HBV genome. HBV cccDNA ChIP sequencing experiment was performed by using NCL or HBc antibody. Read density for each track is represented on the y-axis as HBV-derived reads per million total reads (HBV RPM). Averages and SDs from three independent experiments are shown. The signal of input is blotted as the blue dotted line. HBV transcripts, enhancer elements, CpG islands, basal core promoter (BCP), and highly enriched H3K4me3 binding sites (red) on HBV genome are schematically displayed below the x-axis. The results are representative of three independent experiments. (B) Confocal images of immunofluorescence staining for NCL and HBc. PHHs infected with or without HBV from two different donors were fixed and stained with antibodies against NCL (red) and HBc (green). The percentage of cells with NCL and HBc colocalization in HBc-positive cells was determined by counting three random images from each group. The results are representative of three independent experiments (Scale bar, 20 μm).