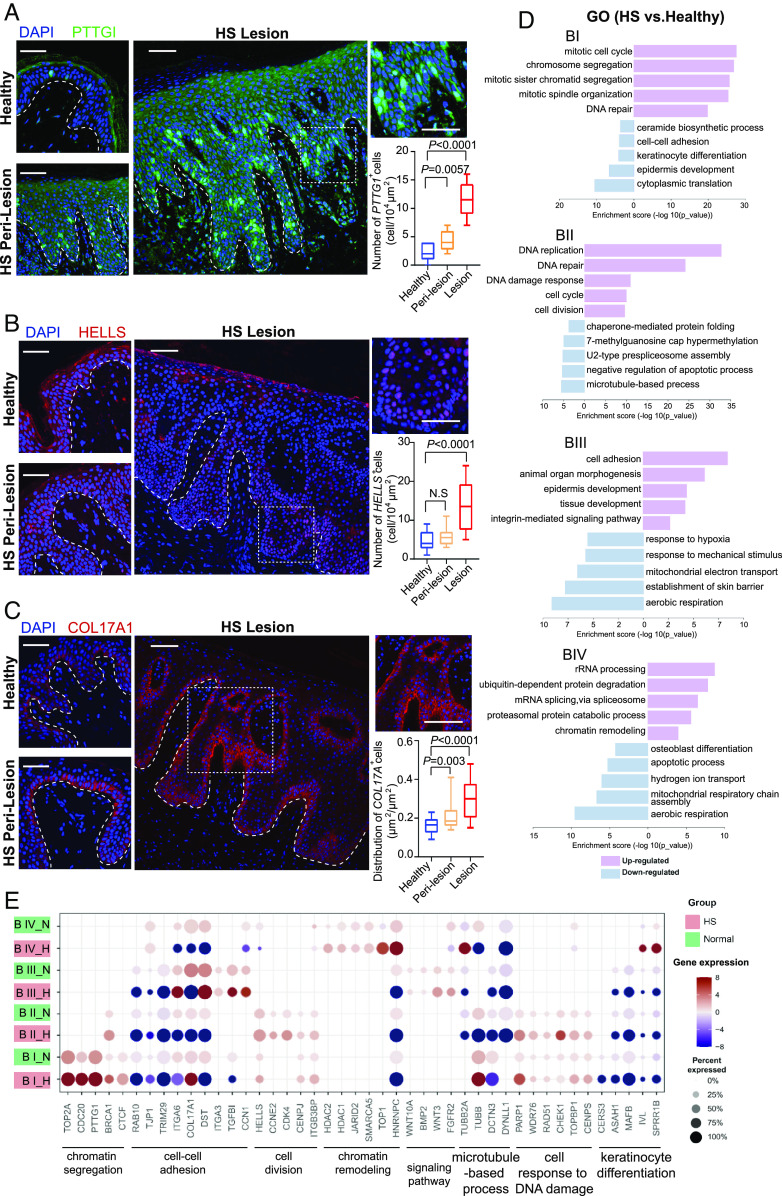
Fig. 2.
Identification of basal stem/progenitor cells in HS lesional skin. (A–C) High-resolution images of healthy and HS skin biopsies immunostained for PTTG1 (A), HELL (B), and COL17A1(C), respectively, along with DAPI. Right Upper, representative images with high magnification of HS lesional tissue sections are depicted. The experiment was performed with six skin tissue each from healthy and HS individuals, respectively, with similar results. Right Bottom, percentage of the indicated number of positive cells per 104 square micrometers (A and B) or the ratio of the positive cell area to the total area (C) determined from histological sections of respective skin (n = 8 areas per sample). The dashed lines demarcate epidermal–dermal boundaries. The experiment was repeated two independent times with similar results (n = 3 biological replicates per group). (D) GO enrichment analysis showing top-ranked molecular functions of DEGs in HS vs. healthy condition within indicated basal clusters. (E) Dot plot showing representative GO genes differentially expressing across basal clusters in healthy and HS samples. Data are presented as mean ± SD, and significance was calculated using the unpaired Student t test (A–C). Magnification, 20× (A–C). [Scale bars, 50 μm (A–C).]

