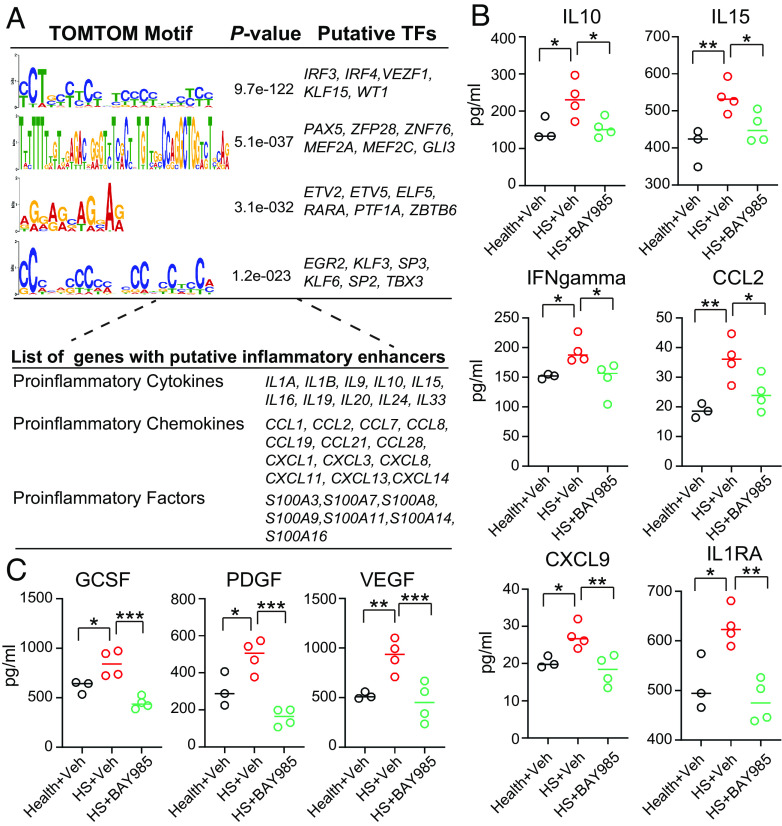
Fig. 8.
The role of IRF3 in regulating the production of HS inflammatory genes. (A) Upper, de novo motifs significantly enriched at inflammatory enhancer groups. TOMTOM outputs motifs ranked by P value. Bottom, representative genes with inflammation enhancers potentially targeted by TFs from upper panel. (B and C) Dot plots showing the overall comparison of indicated cytokines/chemokines/growth factors protein between BAY-985 treated healthy and HS keratinocytes (n = 3 for healthy, n = 4 for HS). P values based on the unpaired Student t test. Error bars indicate the mean ± SD from n = 3 or 4 biological replicates. *P < 0.05, **P < 0.01, and ***P < 0.001. ns, nonsignificant.

