Fig. 3.
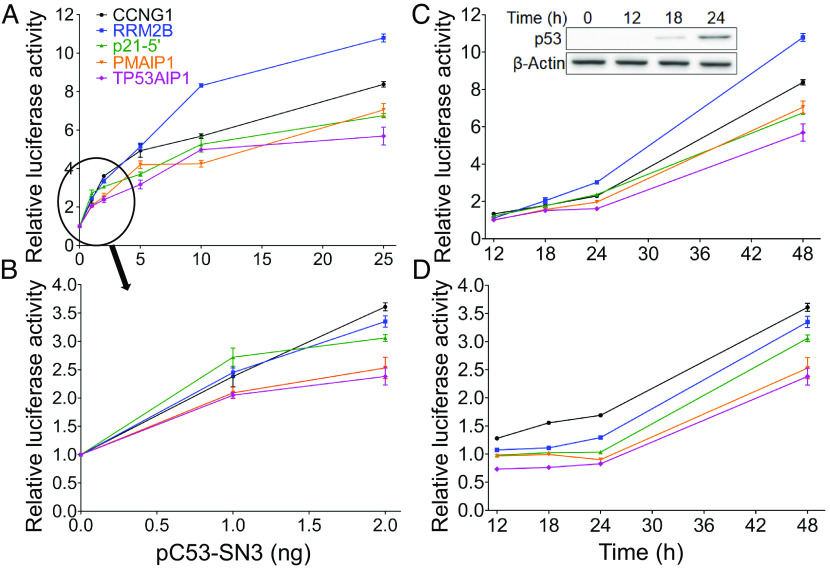
Luciferase activity from p53 REs as a function of the p53 expression level and of time. (A and B), Transactivation in cells transfected with the indicated p53-plasmid amounts measured 48 h post-transfection. (C and D) Fold increase in transactivation levels as a function of time, using 25 ng p53 plasmid (C) or 2 ng p53 plasmid (D). Kinetics of p53 accumulation (0 to 24 h) in cells transfected with 25 ng p53 plasmid are shown in panel C Inset. Luminescence values were normalized to the transfection efficiency of co-transfected, constitutively expressed Gaussia luciferase (Gluc). Results were further normalized first to the empty Cypridina secreted luciferase (CLuc) vector and then to results obtained without p53. Error bars represent the mean ± SD of three to eight independent experiments, each containing two technical replicas. The order of the REs in the legend within (A) is according to the measured torsional flexibility, decreasing from top to bottom.

