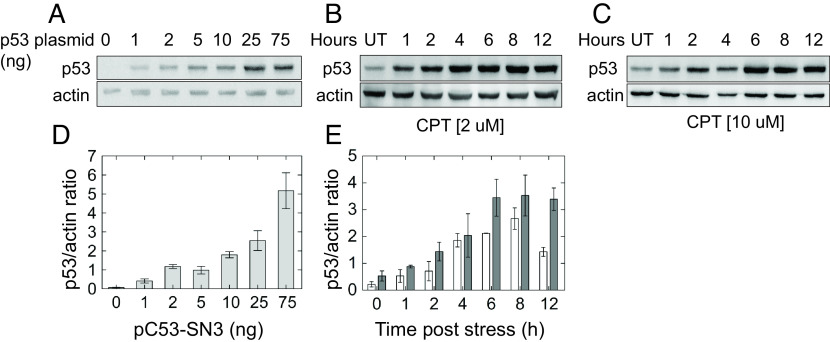
Fig. 4.
Comparison of ectopic p53 levels to its induced levels under stress. (A), p53 null H1299 cells were transfected with the indicated amounts of pC53-SN3 vector. p53 was immunodetected in whole cell lysates collected 48 h post transfection. (B and C) p53 levels in MCF-7 cells treated with 2 µM or 10 µM CPT for the indicated time points. Actin serves as a loading control. Representative gels are shown, UD = untreated. (D) Quantitative analysis for ectopic p53 protein levels shown in (A). (E) Quantitative analysis for p53 levels induced by CPT stress in MCF-7 cells shown in (B), white, and (C), gray. Intensity of bands was quantitated using Cliqs software. Error bars are the result of two to four independent experiments.

