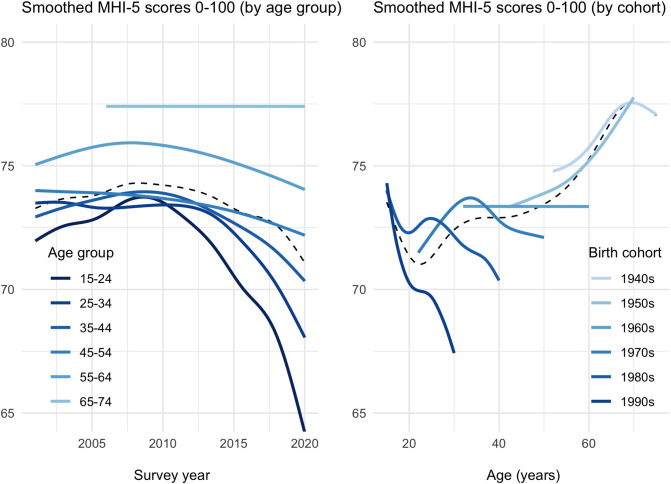
Fig. 1.
Age and cohort effects on mental health over the past two decades. Changes in mental health scores (MHI-5) in each survey year by age group at time of survey (Left panel) and the trends in each birth cohort as it ages (Right panel), where the dotted line represents the average period effect ignoring age (Left panel) or the average age-effect ignoring cohort (Right panel). Deviations from the dotted line indicate the presence of a cohort effect in each case.

