Fig. 2.

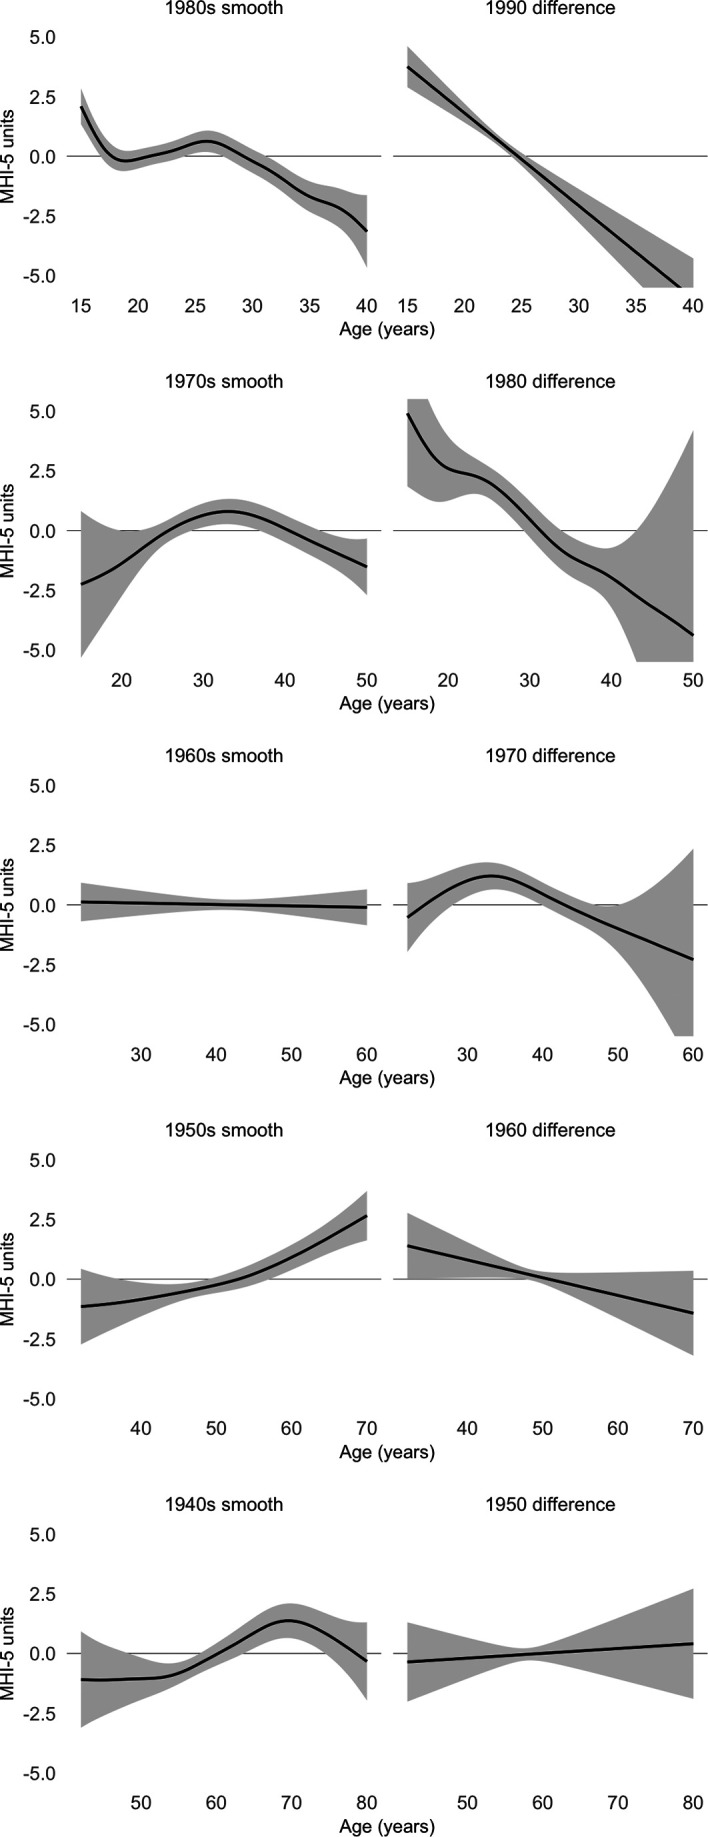
Centered smooth estimates of cohort trajectories (Left) and their differences to the subsequent cohort (Right). The shaded area represents 95% CIs which include the uncertainty about the overall mean as well as the centered smooth itself.

Centered smooth estimates of cohort trajectories (Left) and their differences to the subsequent cohort (Right). The shaded area represents 95% CIs which include the uncertainty about the overall mean as well as the centered smooth itself.