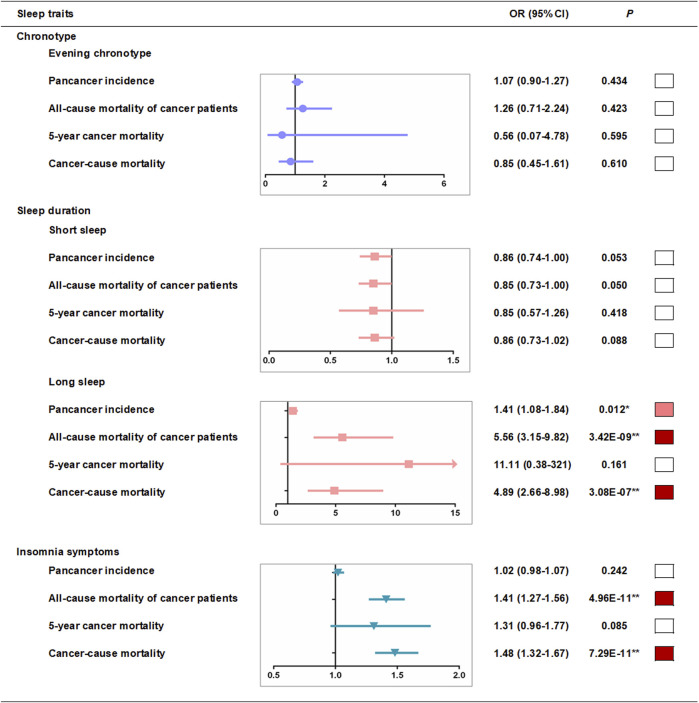
FIGURE 3.
Linear-MR estimates for association between sleep traits and pan-cancer incidence and mortality among cancer patients. Odds ratios are per category in evening chronotype (definite morning [incidence, n = 79,023; all-cause mortality, n = 5,914; 5-year mortality, n = 1,235; cancer mortality, n = 5,703], intermediate morning [106,528; 8,047; 1,711; 7,813], intermediate evening [83,534; 6,045; 1,209; 5,811], and definite evening [27,034; 1,813; 358; 1,738]), per category in sleep duration (≤5 h [1,349; 1,099; 216; 1,046], 6 h [9,997; 3,845; 774; 3,714], 7 h [31,159; 7,905; 6,800; 2,170], 8 h [27,403; 6,800; 1,454; 6,565], ≥9 h [6,401; 2,170; 438; 2,056] in short sleep duration MR analysis and ≤5 h [9,161; 1,099; 216; 1,046], 6 h [35,570; 3,845; 774; 3,714], 7 h [73,791; 7,905; 6,800; 2,170], 8 h [54,817; 6,800; 1,454; 6,565], ≥9 h [12,212; 2,170; 438; 2,056] in long sleep duration analysis) and per category in insomnia risk (no [64,963; 4,729; 1,003; 4,566], some [115,628; 10,192; 2,127; 9,868], and frequent [45,165; 6,898; 1,383; 6,631] insomnia symptoms). ■*p < 0.05 and ■**P < bonferroni-corrected threshold of 0.05/groups. Further adjusted model adjusted for age, sex, assessment centers, top 10 genetic principal components, genotyping array and GRS association factors.

