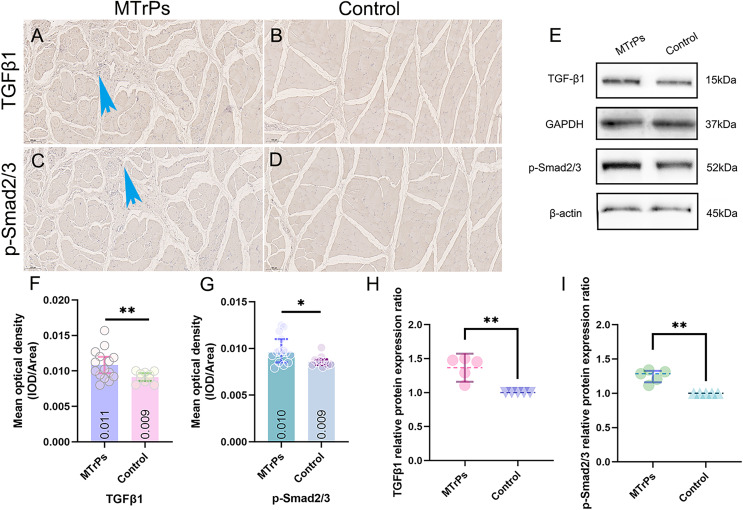
Figure 5. The expression of TGF-β1 and p-Smad2/3 in the vastus medialis muscle of rats was determined by IHC and WB.
(A and C) More brown particles were observed around the disordered muscle fibres in the MTrPs group than in the control group (blue arrow). The control group showed smooth, continuous muscle fibres without contracture nodules (B and D). (E) Immunoblots showing TGF-β1 and p-Smad2/3 protein expression levels and (H and I) Western blot quantification relative to GAPDH/β-actin. *p < 0.05, **p < 0.01, compared to the control group. The data were analysed by independent-sample T tests or Mann‒Whitney U tests; repetitions = 3.

