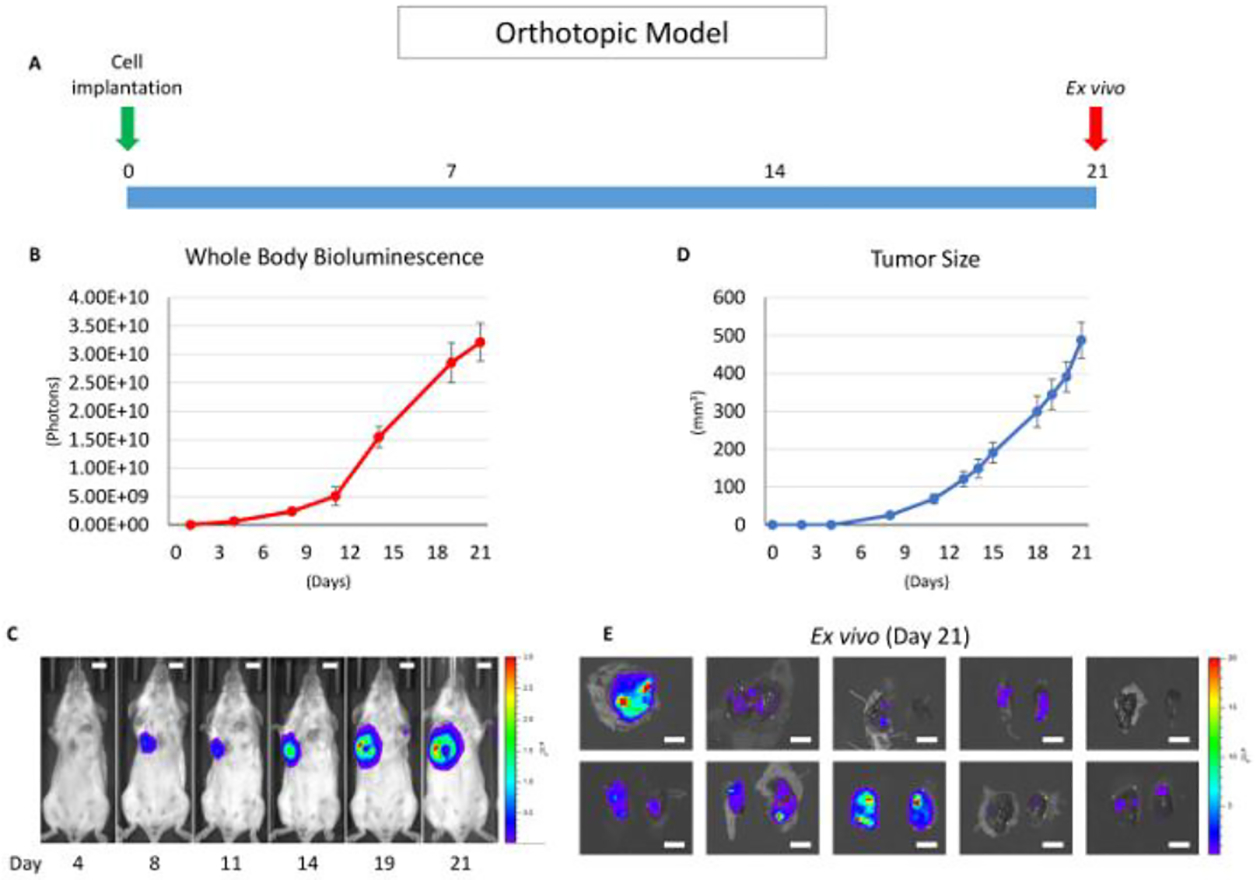
Figure 1: Overview of the orthotopic model without mastectomy.

(A) This panel shows a time course of the orthotopic model utilizing the 4T1 syngeneic model. (B) This panel shows the whole-body bioluminescence of an orthotopic model which mainly reflects the primary tumor. The error bar indicates the standard error of the mean (n = 10). (C) This panel shows serial images of whole-body bioluminescence (of the same mouse). The scale bar indicates 1 cm. (D) This panel shows the actual tumor size of panel B, measured by calipers. The error bar indicates the standard error of the mean (n = 10). (E) This panel shows lung ex vivo bioluminescence images of 10 orthotopic model mice (n = 10). The scale bar indicates 1 cm.
