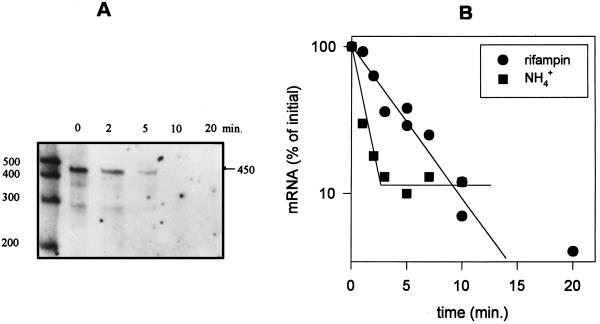
FIG. 4.
ntcA transcript levels after the addition of rifampin or ammonium. (A) RPA analysis of 8 μg of total RNA extracted from cells grown on ASWNO3 at the indicated times after addition of rifampin (150 μg/ml). RPA was carried out with the internal RNA probe. Times (in minutes) after rifampin addition are shown above the lanes. Standards are the same as for Fig. 3. (B) The ntcA transcript levels from RPA analyses were quantified by densitometry and plotted relative to initial amounts (t = 0) at intervals after rifampin (150 μg/ml) and ammonium (2 mM) addition to ASWNO3-grown cells. The half-lives of the ntcA transcript were calculated by a linear regression of the data from the linear portion of the decline. The half-lives were 1.83 ± 0.2 (R2 = 0.95; n = 9) after rifampin addition and 1.28 ± 0.2 (R2 = 0.96; n = 4) after ammonium addition.

