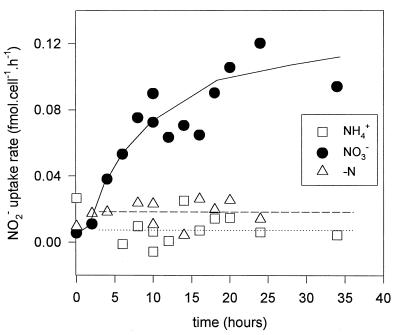
FIG. 7.
Nitrite uptake rates at intervals after the transfer of cells from ASWNH4 to ASWNO3 (NO3−), to ASW0 (−N), or back to ASWNH4 (NH4+). For each time point the amount of nitrite taken up from the medium was monitored for 20 min, and the uptake rate was then determined. Uptake rates were normalized as femtomoles of nitrite taken up per cell per hour. The dotted and dashed lines denote the average uptake rates for cells transferred to ASWNH4 and ASW0, respectively, and the solid line is a line of best fit through the data for cells transferred to ASWNO3.

