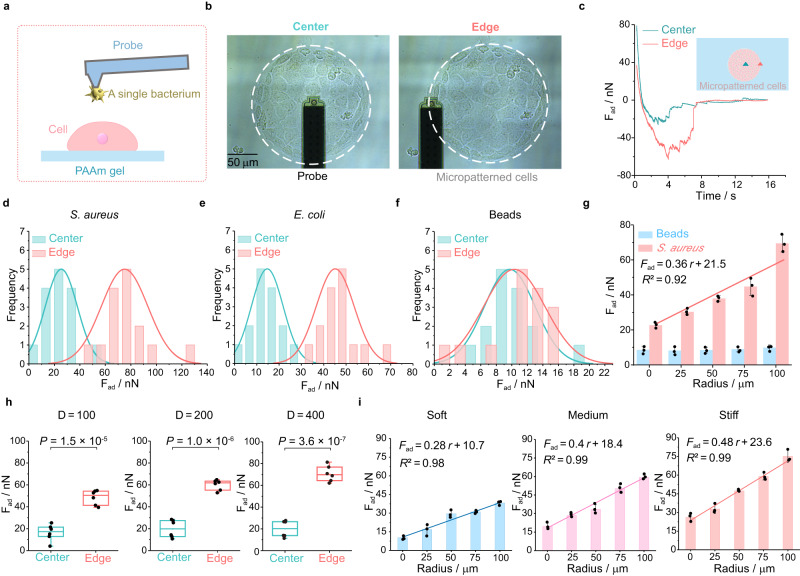
Fig. 2. Quantitative characterization of adhesion forces between single bacterium and micropatterned host cell monolayers with the FluidFM-based SCFS.
a Schematic diagram of quantifying the adhesion forces of a probe-adsorbed bacterium to cell monolayers grown on a PAAm hydrogel substrate with specific stiffness based on SCFS in a liquid microenvironment. b Representative images of bacterial adhesion force measurement at the center and at the edge of the micropatterned cell monolayers. The white dashed line represented the outer boundary of a circular micropatterned cell monolayer (200 μm diameter). Below the little ball at the tip of the black probe was the single bacterium trapped by negative pressure. c Typical time-related adhesion force (Fad) curves between a single bacterium and host cells located near the center and edge of a micropatterned monolayer, which were obtained through the FluidFM-based SCFS. The adhesion force was calculated by quantifying the difference between the lowest point in a specific adhesion force curve and the corresponding one where the adhesion force finally reached a steady state with time. d–f Histograms of the measured adhesion forces of S. aureus (d), E. coli (e) and latex beads (f) to host cells located at the center and edge of these micropatterned cell monolayers cultured on stiff substrates, respectively (n = 15). The fitted curves showed spatial distributions of the measured data, whose peak positions denoted the average bacterial adhesion forces quantified by SCFS. g Comparison of adhesion forces for S. aureus and beads along the radial direction of the circular cell monolayers, which were measured by SCFS (n = 3). h Comparisons of adhesion forces between S. aureus and host cells located near the center and edge of these circular cell monolayers whose diameters were 100, 200, and 400 μm, respectively. Box plots indicate median (middle line), 25th, 75th percentile (box) (n = 6; two-tailed unpaired t-test). i Comparisons of bacterial (S. aureus) adhesion forces along the radial direction of the circular IEC-6 cell monolayers cultured on soft (10.14 kPa), medium (32.29 kPa) and stiff (93.46 kPa) substrates, respectively (n = 3). All representative data were repeated at least three times with similar results. Source data are provided as a Source Data file.

