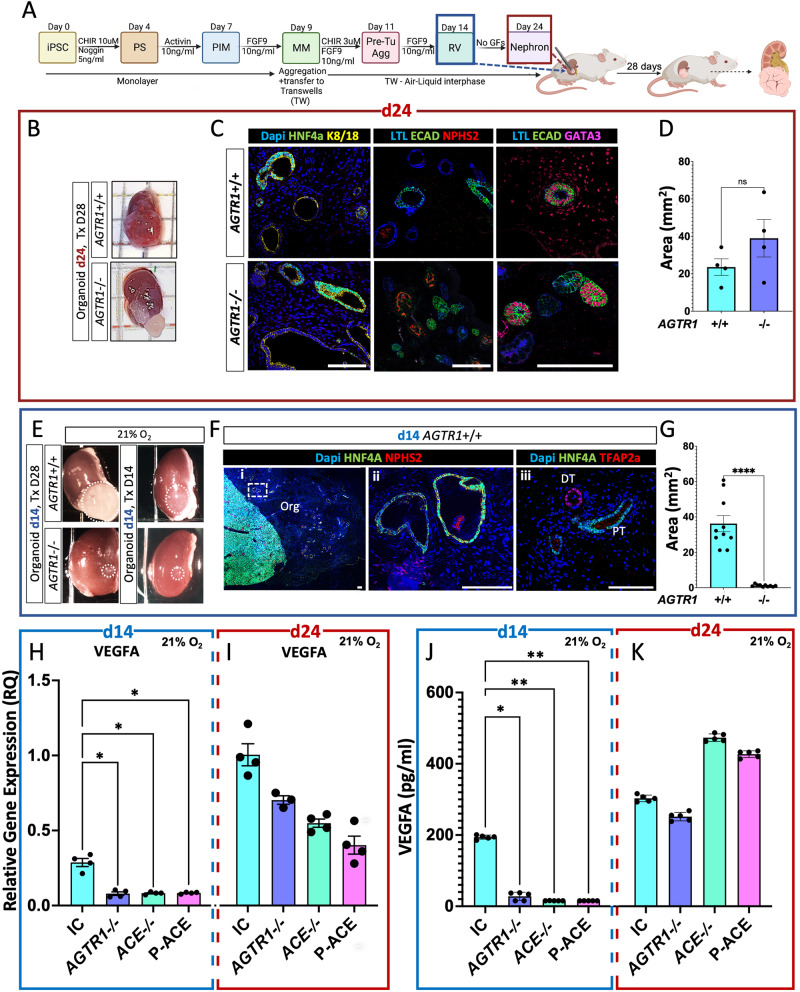
Fig. 5. Organoid transplantation under the kidney capsule of immunodeficient mice reveals dependence on RAAS and VEGF-A for engraftment.
A Schematic illustration of organoids transplantation under the kidney capsule of immunodeficient mice either at the RV stage (d14, blue frames) or after differentiation (d24, burgundy frames), created with BioRender.com. Organoids were left to grow in vivo for 14 or 28 days prior to retrieval and analysis. B representative images of kidneys with engrafted AGTR1-/- or Isogenic Control (IC) organoids transplanted at day 24. C IF Stained AGTR1-/- and IC explanted organoids contain PT (HNF4a, LTL), podocytes (NPHS2+) and DT (ECAD, GATA3). D Comparison of the mean area of four explanted AGTR1-/- and four IC d24 organoids. Results are presented as mean ± S.E.M from each line. Comparison was performed using a two-sided t test. n s= not significant; p = 0.6. E Representative images of kidneys with transplanted AGTR1-/- or IC d14 organoids. Only IC organoids engrafted. F Comparison of the mean area of 10/22 explanted AGTR1-/- and 10/22 remnants of IC d14 organoids. Results are presented as mean ± S.E.M from each line. Comparison was performed using a two-sided t-test. ****p < 0.0001. G IF images of engrafted IC d14 organoid. Frame (i) contains tiled 10x images showing a section of the engrafted organoid and mouse kidney. Wire frame is enlarged in (ii, 40x magnification). A different engrafted organoid was stained for TFAP2a in frame (iii). Scale bars in all frames = 100 µm. Q-PCR analyses of VEGF-A gene expression in d14 (H) and day 24 (I) isogenic control (IC), AGTR1-/-, ACE-/- and P-ACE iPSC-derived organoids. Results are presented as mean ± S.E.M of n = 4 biologically independent experiments. Comparisons were performed using one-way ANOVA on ranks. P-values were adjusted for multiple comparisons using the two-stage step-up method of Benjamini, Krieger and Yekutieli. *p < 0.03, ELISA assay to detect VEGF-A protein in conditioned media from d14 (J) and day 24 (K) IC, AGTR1-/-, ACE-/- and P-ACE organoids. Results are presented as the mean ± S.E.M of n = 5 biologically independent experiments. Comparisons were performed using one-way ANOVA on ranks. P-values were adjusted for multiple comparisons using the P-values were adjusted for multiple comparisons using the two-stage step-up method of Benjamini, Krieger and Yekutieli. *p = 0.04, **p = 0.003, **p = 0.001. Abbreviations: ECAD- E-Cadherin (CDH1), GATA3- GATA binding protein 3. Scale bars=100µm. Source data for Fig. 5D, F and H-K are provided as a Source Data file.

