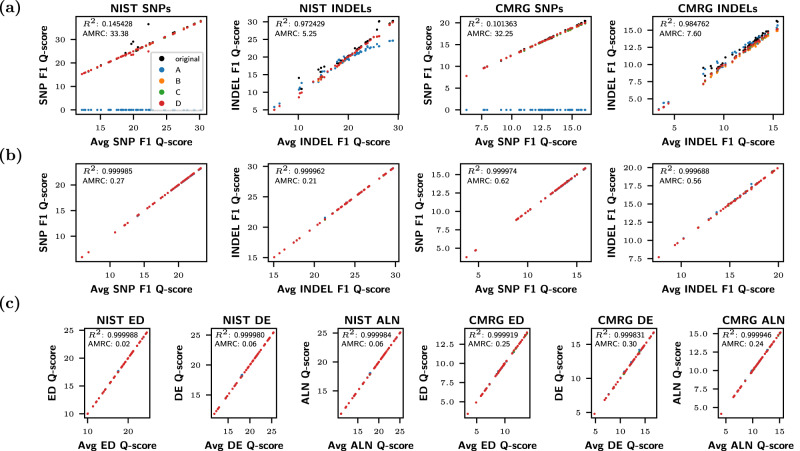
Fig. 6. Evaluation stability results for vcfeval and vcfdist.
a vcfeval and b vcfdist F1 Q-score plots for all Truth Challenge V2 submissions on both the NIST whole genome and Challenging Medically Relevant Genes (CMRG) datasets, for single nucleotide polymorphisms (SNPs) and insertions/deletions (INDELs) separately. c The same information, using sequence distance-based summary metrics (edit distance, distinct edits, and alignment distance; see the Methods section for a full explanation of each). On each graph, average Q-score is plotted against the Q-score for the original representation and at points A, B, C, and D (see Fig. 2). Clearly, vcfdist results in (b) and (c) are more stable in regards to variant representation than vcfeval in (a). Source data are provided as a Source Data file.

