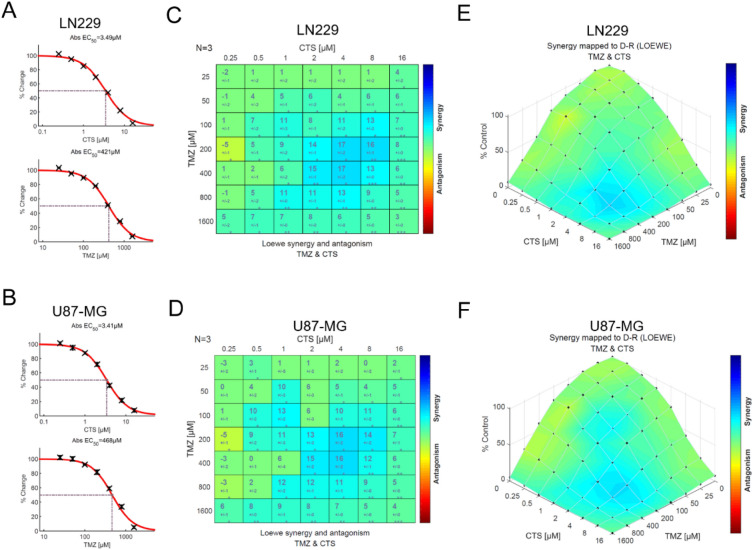
Figure 2.
Characterization of the anti-glioma activity of a combination treatment of CTS and TMZ. (A,B) The IC50 value of CTS and TMZ as single-agent treatments of LN229 and U87-MG human GBM cells was verified with a CCK-8 assay. (C,D) Synergy plots generated by Combenefit depicting the interaction between CTS and TMZ. An analysis of interactions provided HSA and Bliss values (n = 3, technical replicates), indicating synergistic efficacy as calculated from expected and observed growth inhibition. HSA and Bliss values > 0 indicate synergistic effects. (E,F) Single and combinatorial titration of CTS and TMZ in a three-day growth assay of LN229 and U87-MG cell lines (***P < 0.001, **P < 0.01, *P < 0.05).

