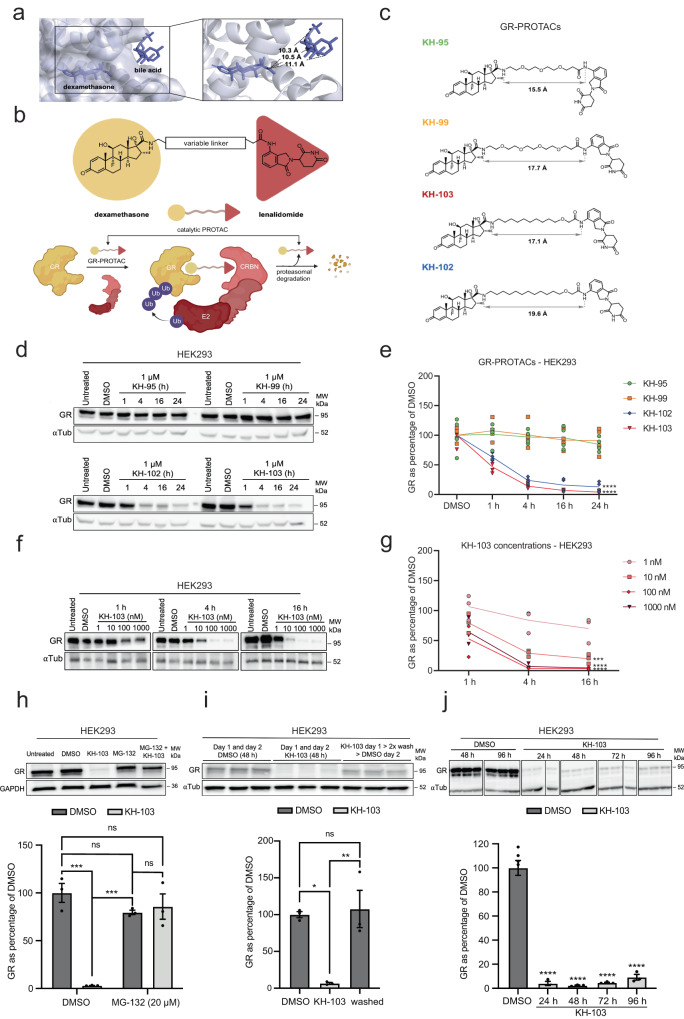
Fig. 1. PROTAC characterisation.
a The crystal structure of DEX and GR in a complex with bile acid (PDB: 4UDC). b Schematic representation of GR-PROTACs (upper row) and the catalytic mode of action of PROTACs (lower row). c GR-PROTAC candidates and their individual linker lengths. d Representative image and e quantification of immunoblots of GR in HEK293 cells following GR-PROTAC treatments (n = 4). (two-way ANOVA main effects for time (F(4, 60) = 34.73, p = <0.0001) and for GR-PROTACs (F(3, 60) = 106.10, p = <0.0001); significant interaction (F(12, 60) = 7.81, p = <0.0001); follow-up Dunnett’s multiple comparisons between compounds vs. DMSO at 24 h KH-102 (p = <0.0001) and KH-103 (p = <0.0001). f Representative immunoblot and (g) quantification of HEK cells treated with various concentrations of KH-103 (n = 3). Two-way ANOVA: significant main effects for concentration (F(4, 30) = 22.91, p = <0.0001) and time (F(2, 30) = 14.43, p = <0.0001). h Representative immunoblot and quantifications of GR degradation by KH-103 in presence of MG-132 (n = 3). Two-way ANOVA: significant main effects for MG-132 (F(1, 8) = 13.90, p = 0.0058) and KH-103 (F(1, 8) = 29.70, p = 0.0006); significant interaction (F(1, 8) = 38.20, p = 0.0003). i Representative immunoblot and band quantification of GR in HEK293 cells following medium exchange (n = 3). Ordinary one-way ANOVA significant difference (F(2, 6) = 14.40, p = 0.0051). Follow-up Tukey’s multiple comparisons showed significant differences for DMSO vs. KH-103 (p = 0.0102) and KH-103 vs. washed (p = 0.0070). j Representative immunoblot and quantification of GR in HEK293 cells treated with KH-103 for up to four days. DMSO n = 6 (pooled 48 h and 96 h DMSO), all other conditions n = 3. Ordinary one-way ANOVA: significant difference (F(4, 13) = 100.00, p =<0.0001). P-values *<0.05, **<0.01, ***<0.001, ****<0.0001. Data are presented as mean values ± SEM. Source data are provided as a Source Data file.

