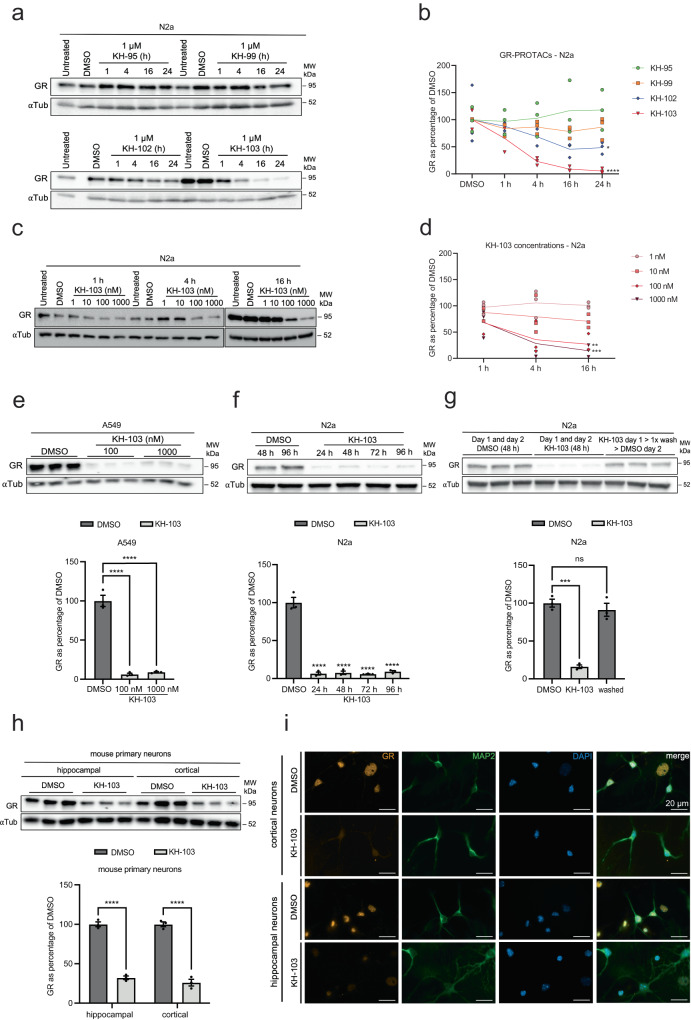
Fig. 2. KH-103 induces degradation of GR in various cell types across species.
a Representative immunoblot and b quantification of GR in N2a cells following GR-PROTAC treatments at multiple time points. Two-way ANOVA: significant main effects for time (F(4,40) = 5.21, p = 0.0018) and GR-PROTACs (F(3,40) = 20.84, p = <0.0001); significant interaction between them (F(12,40) = 2.51, p = 0.0145). Follow-up Dunnett’s multiple comparisons between compounds vs. DMSO at 24 h showed significant differences for both KH-102 (p = 0.0382) and KH-103 (p = <0.0001)). c Representative immunoblot and d quantification of comparison of treatment with KH-103 at various concentrations. Two-way ANOVA significant main effects for concentration (F(4,30) = 14.21, p = <0.0001) and a trend for time (F(2,30) = 3.13, p = 0.0583). Follow-up Dunnett’s multiple comparison tests between various concentrations vs. 16 h time point showed significant differences for 100 nM (p = 0.0032) and 1000 nM (p = 0.0006). e Representative immunoblot and band quantification of KH-103 treatment in A549 cells. Ordinary one-way ANOVA: significant difference (F(2,6) = 58.8, p = <0.0001). Follow-up Tukey’s multiple comparisons showed significant differences for DMSO vs. 100 nM (p = <0.0001) and 1000 nM (p = <0.0001). f Representative immunoblot and quantification of GR in N2a cells treated with KH-103 for up to four days (DMSO treatment for 96 h, GRs depicted as % of 48 h DMSO). Ordinary one-way ANOVA: significant difference (F(4,10) = 150.70, p = <0.0001). g Representative immunoblot and band quantification of GR in N2a cells following medium exchange. Ordinary one-way ANOVA: significant difference (F(2,6) = 60.32, p = 0.0001); Dunnett’s multiple comparisons: significant difference for DMSO vs. KH-103 (p = 0.0001) and no significant difference between DMSO vs. washed (p = 0.5117). h Immunoblot and band quantification of GR in hippocampal and cortical primary mouse neurons. Two-way ANOVA: significant main effects for KH-103 (F(1,8) = 479.20, p = <0.0001). i Immunofluorescent staining of GR and MAP2, a neuronal marker, in hippocampal and cortical primary mouse neurons treated with KH-103. Scale bars are 20 μm. N = 3. P-values *<0.05, **<0.01, ***<0.001, ****<0.0001. Data are presented as mean values ± SEM. Source data are provided as a Source Data file.

