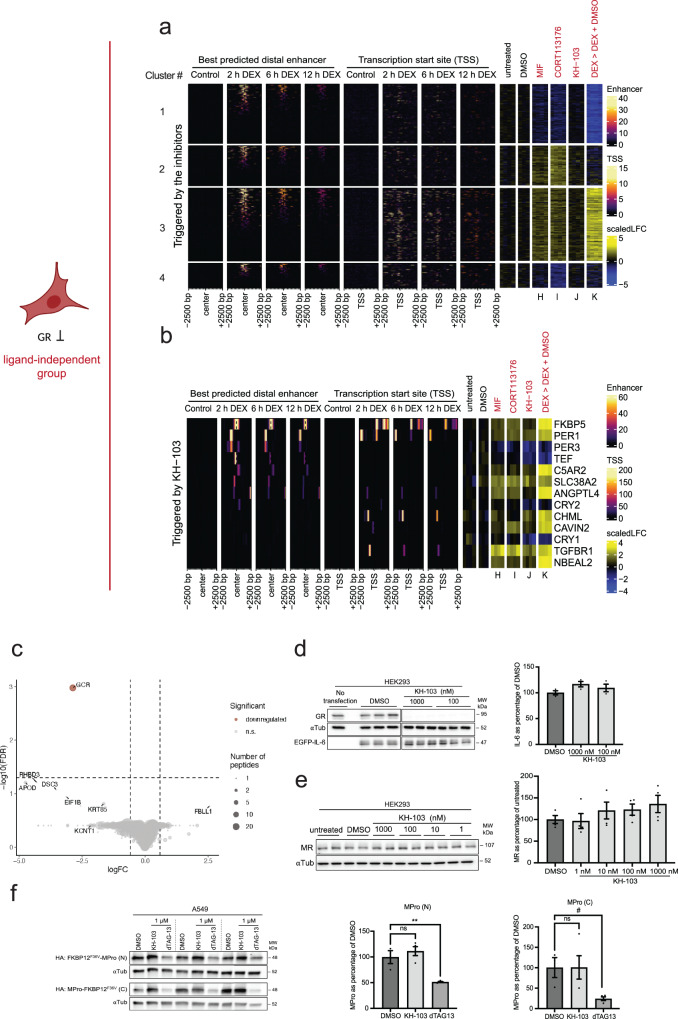
Fig. 8. KH-103 treatment alone has no nonspecific transcriptional effects.
a Heatmap of DEGs of the ligand-independent treatment groups plotted aside GR binding information ±2500 bp centered around their TSS, as well as ±2500 bp centered around their best predicted distal enhancer, after 2 h, 6 h, and 12 h DEX extracted from T. Reddy ChIP-seq data. (DEG analysis n ≥ 3/group; FDR < 0.05, |logFC| >log2(1.2)). b Heatmap of 13 DEGs triggered by KH-103 plotted aside GR binding information ±2500 bp centered around their TSS, as well as ±2500 bp centered around their best predicted distal enhancer, after 2 h, 6 h, and 12 h DEX treatment extracted from T. Reddy ChIP-seq datasets. (DEG analysis n ≥ 3/group; FDR < 0.05; |logFC| >log2(1.2)) c Volcano plot depicting GR as the only significantly differentially down-regulated proteins in A549 cells (n = 4/group) following 16 h 100 nM KH-103 treatment as assessed by label free proteomics. Dot size reflects number of peptides detected per protein. d Immunoblot and quantification of EGFP-IL6 transiently expressed in HEK293 cells treated with KH-103. N = 3. Ordinary one-way ANOVA showed no significant difference between DMSO and different KH-103 concentrations (F(3, 8) = 1.82, p = 0.2215). Follow-up Dunnett’s multiple comparisons tests also showed no significant differences. e Representative immunoblot and band quantification of MR in HEK293 cells treated with KH-103 at multiple concentrations. N = 4 independent experiments. Ordinary one-way ANOVA showed no significant difference between DMSO and different KH-103 concentrations (F(4,15) = 1.03, p = 0.4228). Follow-up Dunnett’s multiple comparisons tests also showed no significant differences. f Immunoblot and quantification of MPro fused with FKBP12F36V transiently expressed in A549 cells treated with KH-103 and dTAG13. For both MPro-N and -C, n = 3 for DMSO, and n = 4 for KH-103 and dTAG13 treatments. Statistical details for the MPro (N) and (C) are summarized in Supplementary Table 4. P-values #<0.1, **<0.01. Data are presented as mean values ±SEM. Source data are provided as a Source Data file.

