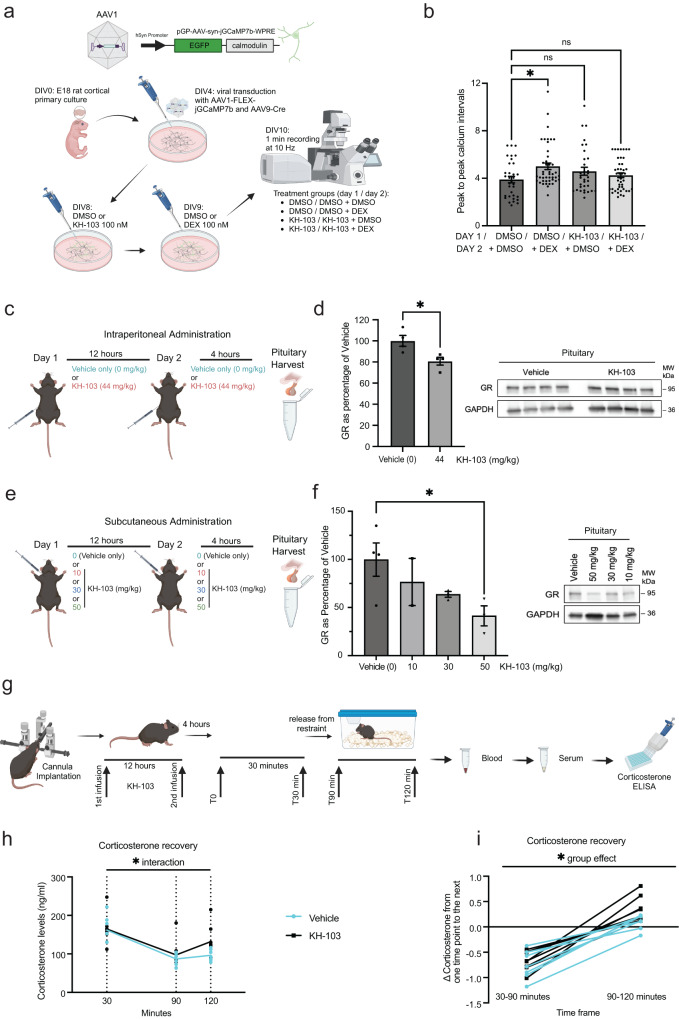
Fig. 9. KH-103 application in primary neurons and in vivo.
a Schematic depiction of jGCamP7b calcium sensor cassette in AAV construct, experimental timeline and treatment groups in rat primary cortical neurons. E18: embryonic day 18, DIV: days in vitro. b Peak-to-peak intervals of calcium signals. Each data point (N) is the average of all intervals for each neuron during 60 s recording. n = 33 for DMSO and KH-103, n = 44 for DEX, n = 43 for DEX + KH-103. Two-way ANOVA: significant interaction between KH-103 and DEX (F(1,149) = 7.17, p = 0.0082). Follow-up Dunnett’s multiple comparison tests: significant difference between DMSO and DEX (p = 0.0113). c Schematic depiction and timeline of KH-103 i.p. delivery and pituitary sample collection in male mice. d GR levels in the pituitary upon intraperitoneal injection of 44 mg/kg KH-103 (n = 4/group). Unpaired t test showed a significant effect of KH-103 t(6) = 3.016, p = 0.0235). Image of immunoblots showing GR protein in pituitary of male mice This experiment was replicated in an independent cohort of animals. e Schematic depiction and timeline of KH-103 subcutaneous delivery and pituitary sample collection in male mice. f GR levels in the pituitary upon subcutaneous injection of 0 (n = 4), 10 (n = 2), 30 (n = 3), 50 mg/kg (n = 3) KH-103 as assessed by immunoblotting. Representative image of immunoblots showing GR protein in pituitary of male mice following subcutaneous injection of KH-103 at increasing dosages. One way ANOVA test for a linear trend: significant effect of successively increased dosage F(1,8) = 8.01, p = 0.022. Unpaired t test: significant effect of DMSO vs 50 mg/kg KH-103 t(5) = 2.623, p = 0.0469). g Scheme depicting timeline of stereotactic injection via implanted cannula, restraint stress paradigm and corticosterone measurements. h Corticosterone levels as measured in blood via ELISA30 minutes following start of restraint, 60 min and 90 min following release. Repeated measurement ANOVA: significant interaction between time and KH-103 administration (F(2,26) = 3.57, p = 0.043, Fisher’s LSD test: t(39) = 2.07, p = 0.045) (Vehicle n = 7, KH-103 n = 8). i Corticosterone dynamics between 30 min following start of restraint, 60 min and 90 min following release. Repeated measurement ANOVA: significant group effect of KH-103 (F(1,13) = 4.79, p = 0.048) (Vehicle n = 7, KH-103 n = 8). P-values *<0.05. **<0.01. Data are presented as mean values ± SEM. Source data are provided as a Source Data file.

