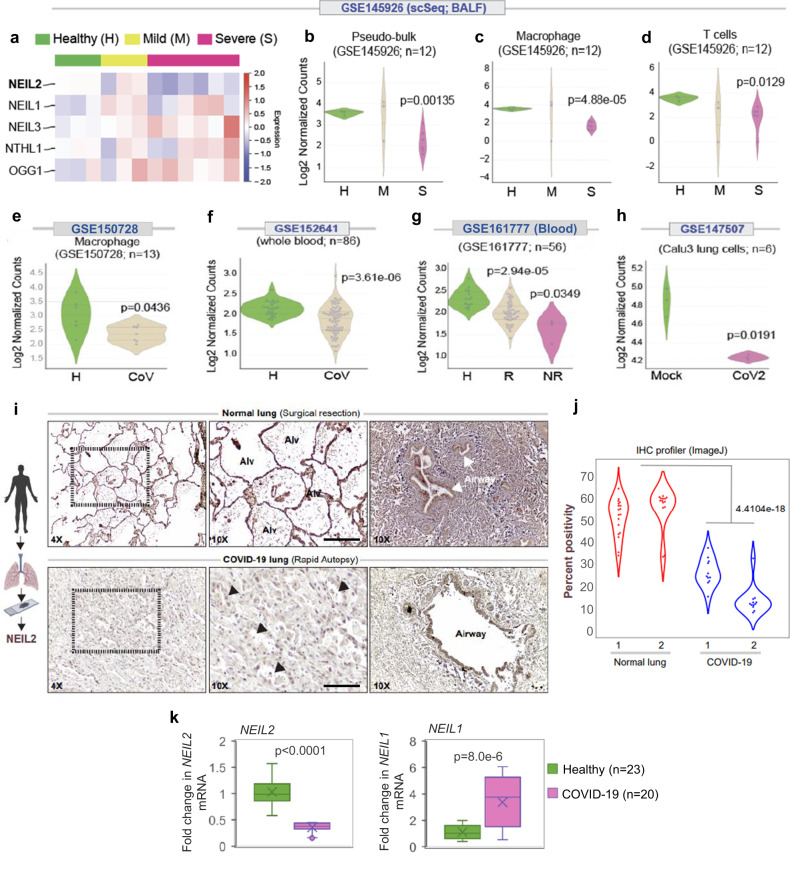
Fig. 1. Downregulation of NEIL2 carries a poor prognosis in COVID-19.
a The heatmap displays changes in the expression of BER-associated oxidized base-specific DNA glycosylases in bronchoalveolar lavage fluid (BALF) samples (GSE145926) obtained from healthy controls and patients with COVID-19. Swarm plots display the levels of expression of NEIL2 in Pseudo-bulk (b), macrophages (c) and T-cells (d) as analyzed in healthy (H), mild (M), and severe (S) patients, in the same cohorts as in (a). Swarm plots show expression of NEIL2 transcript in macrophages (GSE150728) (e) and whole blood (GSE152641) (f) from healthy controls (H) and COVID-19 patients (CoV). g Swarm plot shows expression of NEIL2 in whole blood (GSE161777) from healthy controls (H) and recovered (R) or not recovered (NR) COVID-19 patients. h NEIL2 expression in mock or SARS-CoV-2 infected (CoV2) Calu3 cells (GSE147507). Data was analyzed using log2 (TPM + 1) to compute the final log-reduced expression values for (b–h) (details in Methods). i Schematic created with BioRender.com shows experimental plan. Normal lung tissue obtained during surgical resection (top) or lung tissue obtained during autopsy studies of COVID-19 patients (bottom) were stained for NEIL2. Representative fields are shown (11-18 fields per sample were imaged and analyzed). Arrowheads = injured alveoli. Alv, alveolar spaces. Scale bar = 200 µm. j Violin plots display the intensity of staining between 2 each of healthy normal lungs vs. SARS-CoV-2 infected (COVID-19) lung, as determined by immunohistochemistry (IHC) profiler; data analysis detailed in Methods. k Relative expression of NEIL2 and NEIL1 transcripts in blood cells of COVID-19 patients (n = 20) vs. healthy controls (n = 23). Boxes represent the interquartile range extending from first to third quartile, with the horizontal line representing the median value. Whiskers or error bars represent maximum and minimum values; x in box shows the mean. p-values (unpaired two-tailed Student’s t test) vs. healthy controls for k: Source data are provided as a Source Data file.

