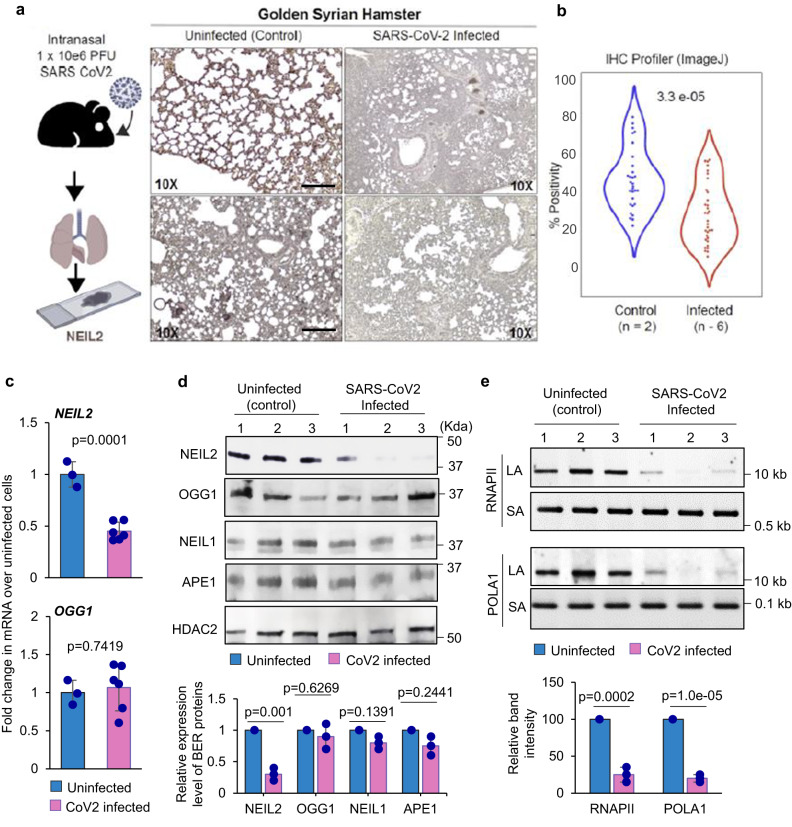
Fig. 2. Downregulation of NEIL2 in golden Syrian hamster lungs infected with SARS-CoV-2.
a The schematic created with BioRender.com shows the workflow to generate the tissue sections from hamster lungs post CoV-2 infection (Left Panel). Lungs harvested from hamsters, uninfected (control) or SARS-CoV-2 infected, were analyzed by IHC for NEIL2 expression (Right Panel). Representative images from two different fields are shown. Findings were reproducibly observed in two separate infected cohorts. Scale bar = 200 µm. b Violin plots display the intensity of staining for NEIL2, as determined by IHC profiler; data analysis detailed in Methods. c Histograms display the levels of expression of NEIL2 (upper panel) and OGG1 (lower panel) in hamster lungs collected from infected (n = 6 biological replicates) vs. control animals (n = 3 biological replicates), as determined by RT-qPCR. d Immunoblots from nuclear extracts of control (uninfected) vs. SARS-CoV-2 infected hamster lungs (10 dpi) (n = 3 biological replicates) using specific antibodies against indicated BER proteins (Upper Panel) and quantification of their relative expression level (Lower Panel). HDAC2 was used as a nuclear loading control. e Estimation of DNA strand-break accumulation [in two representative genes, RNA polymerase II subunit A (RNAPII) and DNA Polymerase Alpha 1 (POLA1)] in uninfected (control) vs. SARS-CoV-2 infected hamster lungs (10 dpi) (n = 3 biological replicates) by LA-qPCR assay (Upper Panel). The normalized relative band intensities are represented in the bar diagram. The mean band intensity of uninfected control mice was arbitrarily set as 100 for (e). Representative images are shown from 3 technical replicates with similar results for (d and e). Error bars represent ± standard deviation from the mean. p-values (unpaired two-tailed Student’s t test) vs. uninfected control for (c–e): Source data are provided as a Source Data file.

