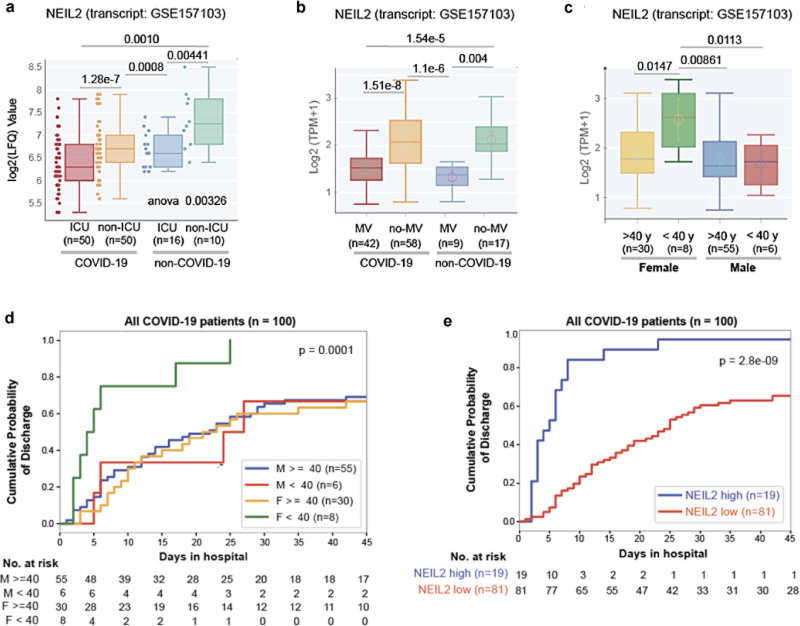
Fig. 3. Correlation between NEIL2 levels and severity, and prognosis of COVID-19 based on patient’s sex or age.
Boxplots display the levels of expression of NEIL2 in a cohort of hospitalized patients (GSE157103), stratified based on their level of care (Intensive Care Unit [ICU] vs. non-ICU) (a) or requirement of Mechanical Ventilator (MV vs. no-MV) (b) and diagnosis (COVID-19 vs. non-COVID-19). c Whisker plots display the levels of expression of NEIL2 in groups of patients (GSE157103) stratified by sex and age (using 40 years as a cut-off). All boxplots (a–c) have a horizontal line at the median and the box extends to the first and third quartile with whiskers extending to 1.5-times the interquartile range. Kaplan-Meier plots display the cumulative probability of discharge from the hospital stratified by sex and age (d) and high vs. low levels of NEIL2 expression (e). Data analysis was performed using lifelines python package version 0.14.6 d (details in Methods).Unpaired two-tailed Student’s t test p-value to compare two groups was used for statistical analysis.

