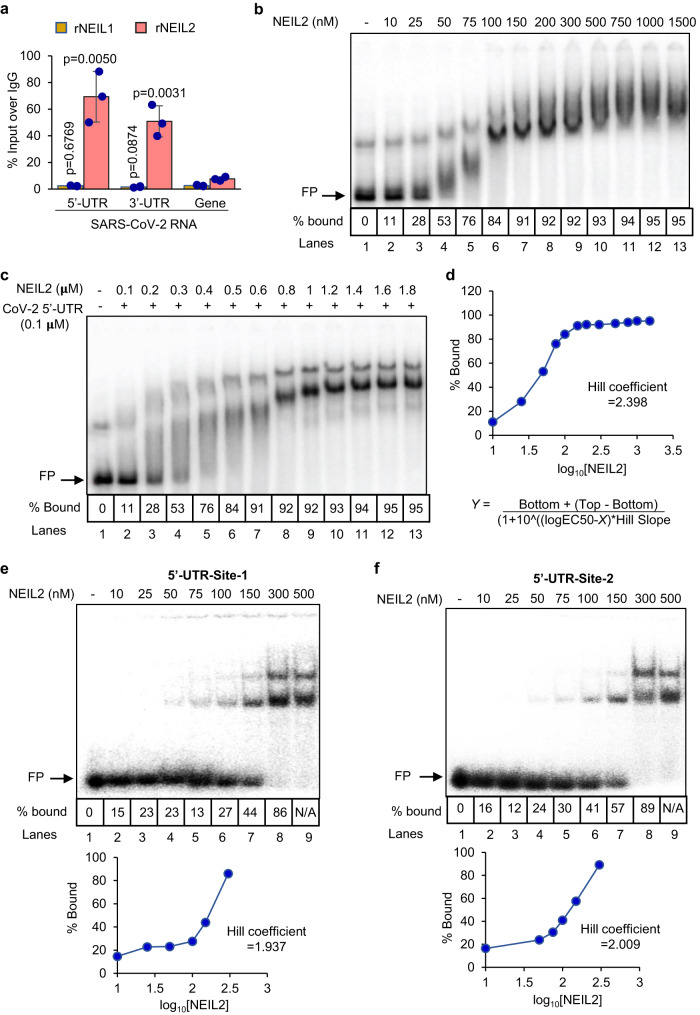
Fig. 5. Analysis of binding of NEIL2 to the 5’-UTR of SARS-CoV-2.
a A549-ACE2 cells were transfected with rNEIL1 or rNEIL2 proteins for 24 h and then infected with CoV-2 (MOI 1.87). Cell extracts were prepared 8 h post infection and subjected to RNA-ChIP analysis using anti-NEIL1 or anti-NEIL2 antibodies or IgG. RT-qPCR was carried out with 5’-UTR, 3’-UTR or gene body specific primers for CoV-2 RNA. Results are represented as % inputs over IgG where error bars show ± standard deviation from the mean; n = 3 independent experiments. p values (unpaired two-tailed Student’s t test) vs. enrichment at gene body. Source data are provided as a Source Data file. b Titration of 1 nM radiolabeled CoV-2 5’-UTR RNA probe with rNEIL2 in an affinity-based binding study as analyzed by RNA-EMSA. c Titration of 100 nM unlabeled CoV-2 5’-UTR RNA traced with radiolabeled RNA probe with rNEIL2 in a stoichiometry-based binding study as analyzed by RNA-EMSA. d Dose-response curve generated by plotting the percentage of bound RNA as shown in b against Log10 of rNEIL2 concentrations for calculation of Hill coefficient using the indicated equation, where bottom = 10, top = 94.42 and EC50 = 46.17 (top and bottom are plateaus in the unit of the y-axis). Titration of 1 nM radiolabeled CoV-2 5’-UTR- ZnF-site-1 (e) and ZnF-site-2 (f) containing RNA probes with rNEIL2 in an affinity-based binding study as analyzed by RNA-EMSA. Dose-response curve were generated by plotting the percentage of bound RNA (bottom panels) against log10 of rNEIL2 concentrations for calculation of Hill coefficient. FP represents free probe. Representative images and quantitation from n = 3 independent experiments with similar results are shown for (b–f).

