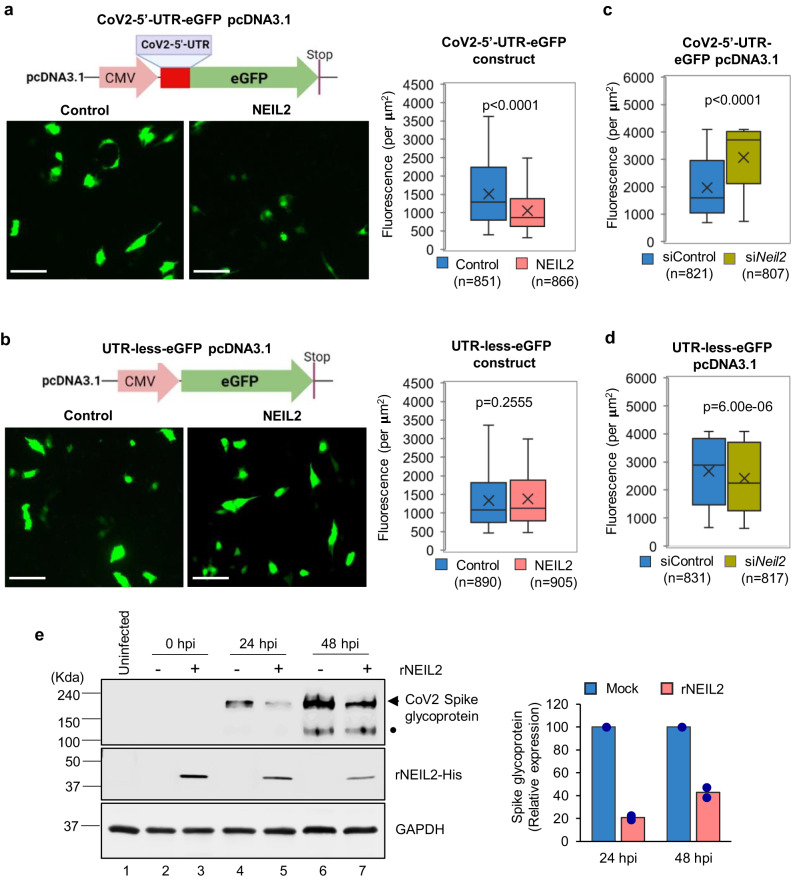
Fig. 6. Effect of NEIL2 on SARS-CoV-2 protein synthesis.
Human BEAS-2B cells, control or stably expressing NEIL2-FLAG (NEIL2) were transfected with CoV-2-5’-UTR-eGFP plasmid construct (a) or a plasmid devoid of CoV-2-5’-UTR (UTR-Less-eGFP) (b), and GFP protein expression was analyzed in live cells after 16 h. Right panels; GFP Fluorescence per µM2 was analyzed from 10 to 14 frames generated in 3 independent experiments. Represented images are shown (Left Panel); Scale bar: 100 µm. HEK293 cells were transfected with control or NEIL2 specific siRNA for 48 h, then transfected with CoV2-5’-UTR-eGFP construct (c) or UTR-Less-eGFP plasmid (d). GFP fluorescence per µM2 was measured in live cells from 10 to 14 frames generated in 3 independent experiments. All boxplots (a–d) have a horizontal line at the median and the box extends to the first and third quartile with whiskers extending to 1.5-times the interquartile range; x in the box shows the mean. n = number of cells used in data analysis. e A549-ACE2 cells were transfected with mock (-) or rNEIL2 (+) for 24 h and then infected with SARS-CoV-2. Cell lysates were prepared at 0, 24 and 48 hpi, and subjected to immunoblot analysis using specific antibodies for CoV-2 spike glycoprotein, His-NEIL2 and GAPDH as indicated. • denotes CoV-2 spike glycoprotein S1 domain. Histogram shows quantification of relative expression level of CoV-2 spike glycoprotein normalized to GAPDH expression (n = 2 biological replicates). All p = values (unpaired two-tailed Student’s t test) shown vs. control cells for (a–d). Source data are provided as a Source Data file.

