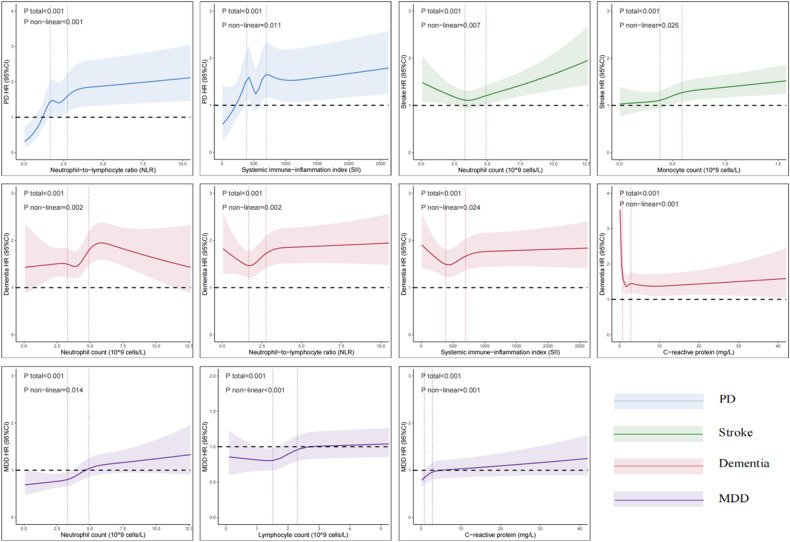
Fig. 3. Non-linear associations between peripheral immunity markers and incident brain disorder.
Restricted cubic spline models fitted for Cox proportional hazards models was utilized, and 11 significant non-linear associations were identified. Two dashed vertical lines indicate 25% and 75% values of each exposure. Results were adjusted for age at baseline, sex, ethnicity, education, SBP and DBP. The colors blue, green, red, and purple represent each brain disorder fitting into PD, stroke, dementia, and MDD categories. HR hazard ratio, PD Parkinson’s disease, MDD major depressive disorder.

